Posts on Security, Cloud, DevOps, Citrix, VMware and others.
Words and views are my own and do not reflect on my companies views.
Disclaimer: some of the links on this site are affiliate links, if you click on them and make a purchase, I make a commission.
SUMMARY: Brian Gracely (@bgracely), Aaron Delp (@aarondelp) and Brandon Whichard (@bwhicard) discuss the biggest AI news stories from the month of July 2026.
An attacker drained 1,196 Bitcoin addresses in 41 minutes on July 30, taking 1,082.65 BTC worth about $70.2 million at the time. Galaxy Research mapped the sweep and tied it to a firmware flaw in Coldcard, the Bitcoin-only hardware wallet made by Canadian firm Coinkite.
A March 2021 firmware integration error routed seed generation to a deterministic software pseudorandom number generator (PRNG) instead of the STM32 hardware random number generator (RNG).
Block says an attacker who can determine or sufficiently constrain the device UID, timer state, and prior RNG-call history can reproduce candidate output streams offline without accessing the device. Candidate seeds can then be checked by deriving their addresses and comparing them with public blockchain data.
Coinkite shipped emergency firmware for every affected model and release track on July 31, but installing it does not repair an existing seed. Coinkite tells owners with exposed seeds to generate a new one on patched firmware and move their coins.
Restoring the old seed to updated firmware or another wallet carries the weakness forward. No public report has reconstructed a victim's seed and matched it to a drained address.
Block traced the fault to Coldcard's production config, which defines MICROPY_HW_ENABLE_RNG as zero because Coinkite supplies its own hardware-RNG wrapper. The libngu library checked whether the macro existed rather than whether it was enabled, binding the build to MicroPython's Yasmarang fallback. The MicroPython fallback was initialized from the chip's unique ID and timer registers and collected no fresh entropy after initialization.
Coinkite estimates effective entropy at roughly 40 bits on the Mk3 and about 72 bits on the Mk4, Mk5 and Q, against 128 bits for a 12-word BIP-39 seed. Block does not give one practical figure. It sets conditional ceilings below 240.7 and 273.3 and warns that the latter is not equivalent to 73-bit cryptographic security. It published no brute-force benchmark.
Image Source: Galaxy Research
The later-model reseed raises the number of candidates, but Block says practical cost depends on available UID information, boot timing, prior RNG calls and derivation cost.
Exposure depends on the firmware running when the seed was created, not the version installed now:
Mk2 and Mk3: Coinkite lists Mk3 versions 4.0.1 through 4.1.9, fixed in 4.2.0, and does not name Mk2. Block places both Mk2 and Mk3 versions 4.0.0 through 4.1.9 on the vulnerable path.
Mk4 and Mk5: anything before 5.6.0.
Q: anything before 1.5.0Q.
Edge builds: before 6.6.0X for Mk4 and Mk5, before 6.6.0QX for Q.
Coinkite says a seed built with at least 50 fair, independent, private dice rolls is not at risk from this bug alone. If the number or privacy of the rolls is uncertain, Coinkite says to migrate. A strong, unique BIP-39 passphrase creates a separate wallet the seed words cannot reach on their own, but the company still recommends replacing the seed.
Multisig helps only when the quorum is not built entirely from affected devices. TAPSIGNER, OPENDIME and SATSCARD use different codebases and are unaffected.
No one has named the attacker. Galaxy, which mapped the 1,196-address sweep, said it found no other Bitcoin transactions in the previous 30 days with the same 30 sat/vB, no-change signature.
It warned that the pattern identifies the operator, not the theft, because a sweep "looks the same as if a coin owner chose to move coins."
The disclosure follows Coinspect's Ill Bloom research in early July, a separate weak-PRNG flaw in older software wallets tied to more than $5 million drained from addresses across Bitcoin, Ethereum, Tron, Rootstock and Polygon since May.
from The Hacker News https://bit.ly/3U8C5D9
via IFTTT
Bitsight says some cheap Android TV boxes have shipped with apps that rewrite their hardware identity to mimic Samsung, Huawei, Xiaomi, or Vivo phones, then click ads on websites run by the same operators.
Researchers named the operation Fuyao and attributed it to Zhejiang Fengwo IoT Technology Co., Ltd., a mainland China company founded in 2019.
The same apps have a second job. When a box detects an HDMI signal, it usually switches to relaying other people's traffic through the owner's broadband line as a SOCKS5 exit node. With HDMI off, it goes back to waiting for ad-fraud tasks.
Bitsight found the operation by registering an expired domain used as a factory backdoor and telemetry collector. Most identifiable devices reported the model name H96_MAX_V11, though Bitsight said its sinkhole view was skewed toward older models from one brand and did not establish a complete affected-model list.
In one day, after filtering for devices carrying the Fuyao apps, the sinkhole received 65,957 reports from about 38,000 unique MAC addresses. Most reports described the devices as phones. That is not a confirmed device count because the system can rotate spoofed identifiers.
The report separately shows Fengwo advertising more than 120,000 "AI digital humans," but does not establish what that marketing term counts. These figures are not interchangeable, and none establishes the physical fleet size. For owners, guidance remains generic: verify Play Protect certification and disconnect suspicious devices from the network.
The command-and-control (C2) server pushes complete phone profiles to each device, merging a base configuration with a per-model diff and deleting chipset properties that would expose a Rockchip, Amlogic, or Allwinner board underneath.
Fuyao uses machine vision inside its automation workflow to locate ads. The Script app carries a YOLOv8s object-detection model named lourui_2, trained on 12 screen elements, including generic banner regions and Taboola widgets. The app combines the model with Android accessibility data and Google ML Kit optical character recognition.
Pedro Falé, a Bitsight threat researcher, wrote that the operation "fuses three vision and reasoning systems into a single interface."
Operators assemble campaign logic in a custom editor built on Blockly, Google's drag-and-drop programming framework. They export each fraud routine as JavaScript, upload it to S3, and send it to the box for execution.
Across four test devices, Bitsight captured about 40 fraud tasks, 21 unique campaigns, and 166 unique modules. A recovered developer comment said the template system let a small group of skilled engineers support less-skilled campaign operators, cutting costs.
Fuyao's payout chain runs through a publishing network. Bitsight mapped 144 operator-owned domains across seven beneficiary clusters. At least 84 of them loaded a Taboola tag on the homepage. The researchers said they used Taboola's public sellers.json file to connect the domains to revenue-collecting entities in Hong Kong and Singapore. Bitsight modeled gross returns at $1.25 per device per day, or about $47,500 daily if 38,000 devices were active.
It separately estimated annual revenue could reach $40 million at the advertised fleet size, citing 30-40% fraud flagging and a 70% ad-fill rate, but did not show the full calculation. Those are estimates, not observed revenue.
Attribution to Fengwo rests on Bitsight, which cited shared TLS certificate data, exposed wiki files, reused email addresses, revenue links, and patents.
Public Chinese patent records independently identify Zhejiang Fengwo as the assignee of related digital-human execution and monitoring technologies. CN117421142B, granted in November 2024, covers execution-flow tracking for digital-human behavior modules, while CN117478834A describes monitoring remote screens through cloud-hosted thumbnails and keyframe comparison. Neither filing describes advertising, and the records do not establish that the company operated Fuyao or engaged in ad fraud.
The sources checked also do not establish who installed the apps or at what point in the device supply chain they appeared.
As of 7:48 p.m. IST on July 31, 2026, Bitsight's blog index still listed only the July 30 overview for Fuyao, and The Hacker News could not find either promised technical follow-up in exact-title site searches. The material checked still lacked a complete list of affected packages, firmware builds, and network indicators. Fuyao-specific identification guidance therefore remains incomplete.
After months of dormancy, the attackers behind the XCSSET malware released version 40 (v40), targeting the macOS ecosystem. This version’s advanced architecture hides its core logic in memory space, reducing its digital footprint.
V40 further enhances its detection evasion capabilities by combining polymorphic payload generation with fileless persistence and dynamic in-memory execution, while weakening a number of security mechanisms on the affected machine.
Since early April 2026, the malware has spread through supply chain attacks by hiding itself in the Xcode projects of dozens of legitimate applications with thousands of active users. Xcode is Apple’s integrated development environment (IDE) for building apps for its various operating systems.
XCSSET’s author enhanced the threat’s ability to spread through open-source projects on GitHub and upgraded its worming capabilities. It can now infect all existing Xcode projects on a compromised system for maximum impact.
The author used a multi-layered cipher shift to conceal the threat’s internal functions. In response, our researchers leveraged advanced AI and pattern-matching algorithms to de-obfuscate the malware's logic.
This article:
Explores XCSSET’s updated stealth practices
Examines the new operational modules
Reveals findings regarding the attackers' rotating command-and-control (C2) infrastructure
Provides mitigation strategies to detect and prevent this threat
Palo Alto Networks customers are better protected from the threats discussed above through the following products and services:
XCSSET is a modular macOS malware family that primarily targets software developers within the Apple ecosystem, spreading through Xcode projects. Threats in this family download task-specific modules from a C2 server, giving it capabilities including:
Browser hijacking
Credential theft
Clipboard monitoring
Data exfiltration
XCSSET’s initial discovery was by Trend Micro in 2020. Security researchers at Microsoft analyzed and documented two subsequent versions in March and September 2025. These updates indicate that the attackers were enhancing their codebase.
In mid-April 2026, we started tracking a new version of XCSSET. We saw a secondary wave of attacks in early May 2026 that introduced an expanded suite of operational modules.
In this new version, we observed a heightened volume of attacks targeting developers across South Asia, which is consistent with Trend Micro's initial 2020 reporting,
While the threat actor has named this latest iteration XCSSET v40, the security community has historically identified only a handful of intermediary versions, none of which featured formal version labels.
Infection Chain Analysis
In this section, we provide a high-level overview of XCSSET v40’s infection chain. The threat’s authors restructured its execution framework to be more stealthy and modular. We provide a complete step-by-step breakdown of each phase in Appendix A.
The malware injects an initial downloader script into benign project files in Xcode projects and vulnerable Git repositories. While the attack lifecycle begins with the infected codebase, the endpoint infection is triggered only when the developer builds that project locally.
The malware scrambles its payload generation at compile time, switching between nested layers of different encryption mechanisms. Figure 1 shows a benign infected Xcode project on GitHub with two separate XCSSET payloads.
Figure 1. Infected Xcode project on GitHub.
The XCSSET v40 infection chain consists of four distinct stages prior to final payload execution:
The initial loader script establishes C2 communication
The second stage collects basic fingerprinting information on the system and downloads further modules
The third stage includes a temporary staging applet that is dropped onto the system to load the final stage into volatile memory space
The fourth stage is the core module logic
The moment this memory-resident core module loop becomes active, the malware terminates its staging processes and deletes all installation files from the disk. The goal of the core-module (internally called boot) is to execute and load additional, specialized modules into memory, such as keyloggers, clipboard hijackers or browser hijackers.
Figure 2 describes XCSSET v40’s infection chain.
Figure 2. XCSSET v40 full infection chain.
New Module Breakdown
Our analysis of XCSSET v40 uncovered 17 distinct modules, each designed for a different goal. The modules were delivered via a dynamic C2 infrastructure and executed in memory.
We found that the operators have enhanced several of its legacy modules while introducing two new components. These include a Chrome hijacking backdoor and a Telegram trojanizer.
We provide the full list of XCSSET v40 modules in Appendix B.
Chrome Hijacking Backdoor via Chrome DevTools Protocol (CDP) Protocol
The Chrome hijacking module controls the browser by misusing a legitimate Chromium feature, the CDP.
For the CDP-based hijacking to work, the malware must redirect how the user interacts with the browser. It does this by wrapping the benign Google Chrome binary in a malicious persistence script. When a victim launches Google Chrome, the wrapper executes a three-step chain:
The orchestrator check: First, it restarts the main XCSSET orchestrator module (boot) every time Google Chrome is initialized, ensuring the malware's core process remains active
CDP execution: It then launches the legitimate Google Chrome application with specific command-line arguments that activate the CDP on a pre-defined local port, exposing the browser's internal engine
chrome_remote backdoor: Finally, it drops and launches a specialized Chrome hijacking binary (chrome_remote). This binary connects to the opened CDP port, allowing the attackers to execute arbitrary JavaScript, manipulate active browser sessions and extract cookie tokens invisibly.
Figure 3 illustrates the module’s infection and execution chain.
The chrome_remote binary dropped by the browser hijacking module establishes a persistent WebSocket connection to the C2 server to pull down real-time JavaScript payloads. Leveraging CDP's ability to inject code before a page even loads allows the malware to force the browser to evaluate and execute these remote scripts on every new tab or document the user opens.
Once injected into a webpage, the malware’s dynamic scripts override critical browser APIs to manipulate the user's active session for the following goals:
Traffic interception: Hooks placed on window.fetch and XMLHttpRequest monitor to exfiltrate sensitive data streams, credentials and API tokens
Crypto wallet manipulation: Intercepting MetaMask's Ethereum provider allows the malware to alter cryptocurrency wallet addresses or manipulate decentralized application (dApp) transactions
This module is able to pivot from a browser hijack to full host-level compromise, operating within the context of the legitimate Google Chrome process. The binary monitors active tabs for specific browser console logging events. If the operator wants to run a local system command on the infected machine, they execute a standardized string such as a console.log prefixed with a specific delimiter.
The chrome_remote binary intercepts this console event, strips the delimiter and passes the remaining payload to the host's underlying shell handler (exec.Command). The resulting shell output is then packaged and routed back through the active CDP WebSocket to the C2 server, establishing a stealthy, fileless reverse shell.
We reported the information about this threat to Google. This behavior is protected against in Windows, and Google is currently working on expanding the same protections to macOS.
Telegram Trojanizer
We identified a new Telegram Desktop trojanizer module in May 2026 that was absent from the April 2026 deployment. The delayed introduction of this module demonstrates that the threat actor was actively refining XCSSET v40 after it was already deployed in the wild.
This new module performs the following activities:
Downloading a pre-built malicious Telegram.app ZIP
Wiping the legitimate copy
Dropping the C2-supplied replacement in its place
Ad hoc code-signing the fake Telegram app
Issuing a kill command to the original Telegram process so the victim relaunches the trojanized copy
This module was updated with a custom AES-encrypted configuration from a dedicated endpoint (/w?tr). We have observed this security mechanism in other modules in earlier iterations of the XCSSET malware family.
The decrypted configuration is written to ~/.tr, and a companion ~/.tr_map file tracks state. Whenever the SHA-1 of .tr changes, .tr_map is cleared. Both files are then uploaded back to the C2 as base_tr_file.txt and base_tr_map.txt.
Because the configuration blob itself was not captured during our collection window, we could not verify its exact contents. However we assess that this is how XCSSET’s operators kept server-side track of which Telegram-related markers existed on each infected host.
This is not the first time XCSSET has been seen targeting Telegram. The original 2020 generation of XCSSET featured dedicated telegram / telegram_lite data-stealing modules. The 2025 XCSSET iteration included the data_folders_finder module that exfiltrated Telegram's chat history, cached files and local encryption keys.
The newest Telegram trojanizer represents a meaningful escalation in the attacker’s access to the app. Rather than a one-time copy of Telegram-related data, the attacker now replaces the application binary itself, giving them an in-process foothold.
The Invisible Malware: New Tactics, Techniques and Procedures (TTPs) Breakdown
When analyzing v40, it became clear that XCSSET went through architectural changes and made core changes to its TTPs.
The attackers behind the malware enhanced its stealth practices to sabotage detection and thwart analysis, while also adding new persistence and data theft methods. This section highlights the recent TTPs observed in v40 illustrated in Figure 4, including:
Multi-layered encryption
Polymorphism
New fileless persistence
Impairing defenses
Virtual machine (VM) evasion
Figure 4. New XCSSET v40 TTPs.
Multi-Layered Polymorphism and Encryption
The architectural hallmark of XCSSET v40 is its defense-evasion framework, combining overlapping layers of polymorphism and a dual-key encryption scheme. Rather than relying on a single defensive trick, the malware implements a multi-tiered cryptographic gauntlet across its binaries, network payloads and internal source code. Figure 5 describes the XCSSET v40 evasion stack:
Figure 5. Layers of polymorphism and encryption in XCSSET v40.
Binary and Network-Level Polymorphism
The malware leverages polymorphism to rotate its digital fingerprints and evade detection. The loader binary, which is responsible for executing the core modules in memory, is recompiled on the C2 server every few hours. During analysis, we observed eight distinct hashes delivered to a single endpoint within a 24-hour window.
The functional modules streamed to the orchestrator are polymorphic. Each component is encrypted via AES-256-CBC using a per-build key and a randomized Initial Vector (IV) prepended to the ciphertext. Because the IV shifts with every single transmission, even two identical modules served seconds apart will result in two different encrypted blobs. Figure 6 illustrates the encrypted payload injection process into osascript as detected in Cortex XDR.
Figure 6. Encrypted module payload injected to XCSSET v40’s loader.
Network Level Dual-Key Architecture
While previous versions of XCSSET protected their C2 communications using a single, hard-coded plaintext key, v40 introduces a dual-key architecture that separates inbound and outbound encryption.
Unlike its predecessors, XCSSET v40 embeds its inbound key within the compiled AppleScript loader. As a result of this compartmentalized key placement, defenders who retrieved the outbound key from network telemetry will not be able to decrypt and access the core logic of the malware.
Module Source-Code Obfuscation and String-Literal Ciphers
The malware applies a third layer of polymorphism at the structural code level. Every internal string literal is dynamically encoded using a per-module keyed Caesar cipher featuring a randomized 52-character alphabet and variable shift values. As a result, no two builds of the same module share common string signatures.
XCSSET v40’s developers also implemented a pre-compilation substitution cipher for all internal module, function and variable names. Because this obfuscation takes place on the C2 server before distribution, the decryption mapping is absent from the host endpoint. This absence means that analysts cannot reverse a local execution routine to reveal the original code structure.
Figure 7 includes a scrambled source-code module with decrypted string literals.
Figure 7. Encrypted function names in the boot module.
By leveraging advanced pattern matching and LLM assistance, we broke the identifier substitution cipher. This allowed us to trace the obfuscated module and function names back to their original, operator-assigned names. This allowed us to dive into the malware’s core logic.
XCSSET adopted new technologies to scale their operations. This can also be a reminder for the threat intelligence community that defenders can harness those same capabilities to neutralize this threat.
New Fileless Persistence
Beyond introducing polymorphic capabilities, XCSSET v40 also added a new fileless persistence to its TTPs. In addition to its usual persistence through Git hooks, Launch Daemons and trojanized applications, v40 adopted another method that misuses the macOS defaults configuration system.
Defaults is the macOS counterpart to the Windows Registry, which is a built-in mechanism for managing user preferences and application settings.
Historically, macOS malware families like NetWire and FruitFly have misused the defaults utility to store state data. XCSSET v40 instead uses this utility to shift from predictable, disk-resident persistence to a fileless re-infection loop.
Rather than dropping additional scripts on disk between cycles, XCSSET v40 writes a Base64-encoded staging payload into a preferences domain it generates per host. Inside the domain, the malware writes the payload under keys that are meant to seem random, like mpirv_eahpi_apm or ychax_muwch_ucy. When a victim launches a trojanized or hijacked application, the threat runs a one-liner to retrieve and decode the payload:
The decoded blob re-infects the host, with the SRC tag identifying which infection vector (e.g., hijacked browser, infected Xcode project or trojanized application) is responsible for triggering the re-arm.
Beyond standard persistence, XCSSET v40 uses the defaults system during initial infection to store and query system information. Misusing defaults as an operational configuration cache is uncommon in the macOS malware landscape.
Impairing Defenses
XCSSET v40 also introduces significant defense-evasion techniques that were not observed in prior campaigns. In this multi-part effort to thwart Apple’s defenses, XCSSET v40:
Disabling the SoftwareUpdate Configuration Channel
XCSSET v40 executes the following commands to hinder the machine’s ability to receive security updates:
Setting these values to false prevents the endpoint from automatically retrieving updates to crucial macOS signature databases like:
XProtect
MRT
TCC
This also prevents access to Apple's Rapid Security Response channel, which delivers emergency patches between full macOS releases.
Termination of Cloud Telemetry Mechanisms
XCSSET v40 runs a constant loop that hinders the endpoint’s ability to send security-related data through the CloudTelemetryService process. This evasion method blocks the transmission of local security telemetry to Apple, ensuring that the operator's tooling is not sampled into subsequent XProtect signature releases.
Exclusive File Lock on the XProtect Signature Database
The malware spawns a Perl process that tries to acquire and hold access to the endpoint's YARA-rule database (XPdb). This exclusive file lock on the XProtect signature database ensures that if the endpoint does receive a security update, its content could not be written to disk.
TCC Database Reset Upon Denial of Permissions
Prior XCSSET versions terminated module execution when the user denied AppleEvents automation prompts. XCSSET v40 instead invokes tccutil resetAppleEvents, which clears the user's TCC decision database for the AppleEvents service. It then reloads a TCC prompt, masquerading as System Settings or Xcode to trick the user into re-granting automation permissions to the malware's bundle ID. The subsequent automation request is treated as a first-time prompt, redisplaying the consent dialog.
Anti-VM Reporting
XCSSET v40 also attempts to avoid running on VMs. Upon execution of the stats module (one of the first modules downloaded to the machine), the module generates a set of checks on the machine’s CPU and hardware metadata. This check is to determine whether or not the infected endpoint is a VM.
Once the module performs those checks, it calculates a final verdict ("Model Identifier suggests VM: false", "Result: likely physical") and ships the results over to the C2. Hosts reporting a virtual environment receive no further module deliveries, ensuring that automated sandboxes do not analyze XCSSET’s core logic.
C2 Infrastructure Analysis
By analyzing XCSSET v40’s Uniform Resource Identifier (URI) structure and domain registration strategies, we were able to learn more about the timeline of the most recent campaign. We even found several operational security (OPSEC) failures that provided insights into the attacker’s strategies and capabilities.
Endpoint URL Breakdown
XCSSET v40 shows a clear pattern of URL endpoint structure throughout the campaign, assigning distinct functionality to each URI endpoint as shown in Table 1.
Loader and stager retrieval during initial infection
/s/<rotated_module_name>
GET <Base64- + AES-encrypted payload>
AppleScript module retrieval (executed in-memory)
/l
POST -d <Base64 payload>
Status and log reporting
/u
POST -F m=<Base64 payload>
File exfiltration
/p
POST -d t=…&u=…&s=…
Heartbeat
/w?<cmd>
GET
Server-side dynamic configuration retrieval (e.g., /w?cbp for clipboard, /w?tr for telegram)
/e
POST
Browser-hijack events
Table 1. XCSSET v40 URI endpoint breakdown.
Domain Registration and Staging Strategy
XCSSET v40's C2 infrastructure reveals a distinct domain registration strategy. In early 2026, the attackers registered about 40 different domains in at least four short bursts across a small pool of IP addresses. The operator staged and aged these domains months before launching the attack wave, to bypass detection of newly registered domains.
Geographically, the attackers’ targeting parameters and naming conventions have also evolved. While the 2025 campaigns relied on [.]ru (Russia) domains masquerading as legitimate content delivery networks (CDNs) and tech properties, the 2026 attack wave introduced [.]in (India) names registered alongside identical [.]ru siblings. This geographic infrastructure pivot aligns with recent victimology, matching our observations of XCSSET v40 targeting developers across South Asia.
OPSEC Failures
Despite mitigating detection risks by aging their domains, the attackers compromised their own campaign through poor OPSEC. Specifically, they cross-contaminated the IP addresses hosting those domains across different XCSSET campaigns.
Furthermore, all four operator IP addresses are linked by a single shared SSL thumbprint (6e480d648fa1b70612f5d198a66875e28847547d), reused SSH keys and a shared self-signed remote desktop protocol (RDP) certificate.
Mitigation Strategies
Defending against XCSSET v40 requires defenders to use real-time behavioral enforcement to flag runtime irregularities. Unit 42 suggests the following mitigations to detect and prevent this threat:
Implement AI-enhanced process anomaly detection capable of flagging runtime irregularities, specifically monitoring for abnormal AppleScript instances
Monitor browser launcher paths and block unauthorized file-write activity
Identify and block the creation of abnormal local system defaults domains and their modification through the defaults utility
Track ad hoc signed applications and untrusted local code signers, immediately isolating binaries that bypass native Apple Gatekeeper requirements
Implement automated supply-chain dependency scanning to intercept poisoned open-source repositories before they are pulled into internal developer pipelines
Conclusion
The latest XCSSET version demonstrates a persistent and specialized threat within the macOS landscape. Rather than relying on conventional delivery methods, the framework turns legitimate developer workstations into automated, self-propagating supply chain vectors.
The discovery and analysis of XCSSET v40 reveals a modular framework for exfiltrating data, subverting system security and performing persistent browser hijacking.
While the malware's historical reliance on AppleScript and bash stagers remains consistent, v40 introduces a significant technical evolution in defense evasion. By adopting a largely memory-resident and polymorphic architecture, XCSSET v40 leaves a minimal disk footprint.
Because adversaries are now using AI-enhanced pipelines to generate polymorphic code on the fly, defenders must shift to AI-driven behavioral analysis to identify unusual or suspicious process chains and flag anomalous use of built-in detection mechanisms.
Palo Alto Networks Protection and Mitigation
Palo Alto Networks customers are better protected from the threats discussed above through the following products:
Cortex XDR and XSIAM
At the endpoint level, Cortex XDR blocks XCSSET on macOS hosts using Behavioral Threat Protection (BTP) to terminate fileless, in-memory execution chains—including suspicious osascript calls, multi-pass base64/xxd decoders, and process spawning from infected .xcodeproj build phases—while Advanced WildFire inspects and blocks payloads on disk.
At the Security Operations level, Cortex XSIAM correlates these host-level detections with developer repository, network, and identity telemetry, providing SOC analysts with a unified attack narrative and automated playbooks to stop cross-environment supply-chain propagation.
If you think you may have been compromised or have an urgent matter, get in touch with the Unit 42 Incident Response team or call:
North America: Toll Free: +1 (866) 486-4842 (866.4.UNIT42)
UK: +44.20.3743.3660
Europe and Middle East: +31.20.299.3130
Asia: +65.6983.8730
Japan: +81.50.1790.0200
Australia: +61.2.4062.7950
India: 000 800 050 45107
South Korea: +82.080.467.8774
Palo Alto Networks has shared these findings with our fellow Cyber Threat Alliance (CTA) members. CTA members use this intelligence to rapidly deploy protections to their customers and to systematically disrupt malicious cyber actors. Learn more about the Cyber Threat Alliance.
Appendix A - XCSSET v40 Infection Lifecycle Breakdown
The infection lifecycle of XCSSET v40 can be categorized into four phases, as detailed below.
Phase 1: Initial Compromise and Execution
The infection lifecycle begins when a developer opens a poisoned Xcode project, typically downloaded from GitHub or built internally:
The moment the developer builds the project locally, a malicious run-script phase executes silently in the background
The malware dynamically scrambles its payload generation at compile time, switching between nested layers of Hex- and Base64-encoding
This decoded script initiates contact with the attacker’s C2 infrastructure by executing a curl request to the /a with basic execution context (p=xcode_phase) to retrieve the next stage
Phase 2: Host Reconnaissance and Staging
The retrieved staging payload runs a second, specialized curl command that collects and exfiltrates primary host metadata
The payload queries the operating system type (uname -s) and the current username (whoami), transmitting these details back to the C2 endpoint
Phase 3: Loader Wrappers and Binaries
If the C2 approves the host profile, it returns a bash script obfuscated via a custom substitution cipher. This script handles the high-risk task of staging the main loader while covering its tracks:
The bash script performs deeper hardware fingerprinting, matching the host's serial number against targeted profiles
It then pulls the primary malware loader to /tmp/r and compiles an accompanying AppleScript wrapper as /tmp/p.app on the fly
To eliminate forensic evidence, the loader wrapper is executed in memory by osascript, which in turn downloads the main orchestrator module and its AppleScript loader
After execution, the malware terminates osascript and deletes both /tmp/r and /tmp/p.app from the disk to minimize its forensic footprint
Phase 4: Orchestrator and Core Logic Modules
Once it erases its disk footprint, the malware transitions to a mostly fileless execution:
The main orchestrator module named “boot” by the developers runs and retrieves additional module payloads from https://<C2>/s/<encoded_module_name>
Finally, the orchestrator pipes the payloads to the AppleScript to decrypt and execute the modules in memory
Appendix B - XCSSET V40 Module Breakdown
This appendix maps the 17 modules identified in XCSSET v40. We correlated the canonical XCSSET v40 module names recovered through our decryption efforts with the terminology used in the three prior public reports.
Please note that since XCSSET has gone through major architectural changes in v40, some modules’ logic may be expanded or split into different modules. It is also worth noting that previous reports of XCSSET did not decrypt the original module names, and therefore they appeared as jumbled strings.
Module Name
Previously Recorded Names
Functionality
boot
boot, bootstrap
Main orchestrator, module-dispatch loop
stats
vexyeqj, seizecj
Initial reconnaissance on the infected endpoints, exfiltrates existing browser extensions, performs anti-VM checks
logic previously existed in dfhsebxzod and replicator modules
Split out in v40 from replicator_finder. Recursively traverses user directories to identify and infect Xcode projects present in .zip archives.
data_folders_finder
finder, txzx_vostfdi, neq_cdyd_ilvcmwx
C2-driven folder finder and data exfiltrator
firefox_data
iewmilh_cdyd
Infostealer targeting Firefox
notes_app
cozfi_xhh
Apple Notes exfiltrator
settings_app
xmyyeqjx
LaunchDaemon-based persistence using a fake Settings.app, defense evasion by blocking XProtect features
finder_app
finder_app, vectfd_xhh
TCC permission misuse and reset, creates trojanized app that mimics Finder/ Xcode/ Terminal/ Reminders/ SimulatorTrampoline
persist
hfdieiz, some of the logic previously existed in xmyyeqjx
.zshrc and Dock-app based persistence
browser_remote
chrome_remote, firefox_remote, opera_remote, yandex_remote, brave_remote, edge_remote, 360_remote (one module per browser, each downloads a backdoor masquerading as browser from the server; uses an exploit to hijack the actual browser)
Unified browser-hijack dispatcher checks for existing browser on the endpoint and dispatches different hijacking modules
safari_remote
safari_remote
Browser hijacker
chrome_remote
new module (v40)
Browser backdooring and hijack through CDP protocol
Note: Trend Micro’s 2020 report mentions a module named chrome_remote, but v40’s module has different functionality
Welcome to this week’s edition of the Threat Source newsletter.
For my fianceé’s 30th birthday, I took her on a weekend trip to Shenandoah National Park – a favorite of ours since we went to a wedding there several years back. We’ve done several incredible hikes over the years, but one in particular had always loomed over my head: Old Rag, a 9.3 mile circuit hike that’s largely considered the most difficult in Virginia.
I've always been warned that at the beginning and end, you hate Old Rag. For the first 2.6 miles, you’re hiking a steep climb on a dirt road, with lots of switchbacks, and plenty of places where you turn a corner and groan, because there’s an even steeper section ahead. This part was pretty torturous, because 1) I felt like my heart was going to explode out of my chest, 2) I couldn’t breathe, and 3) several times, there was a family we passed as they were taking a break, then WE took a break and THEY passed US, and so on and so forth. So awkward.
Finally, we reached the fun part: a mile-long rock scramble, where you're squeezing through (and down) narrow rock crevices, cramming your boots to desperately find any leverage to propel yourself upward, and using all your upper body strength to control your descent. This was definitely the most fun part, although my hands and knees were sore by the end.
After hiking for hours, you reach the top and realize it was all worth it, because the summit has a a spectacular vie—
... That’s what we get for being excited to hike in overcast weather. Well, at least the way back down is fun— oh wait, four miles downward on a fire trail, crushing your toes in the front of your hiking boots? Yike.
It may sound like I’m complaining a lot about this hike, but it was genuinely the most fun one that I’ve done to date. By the time I was freshly showered and drinking an iced coffee in Culpeper, I was gushing about when we’d go back.
There’s a really good tie-in to cybersecurity somewhere here. Ah, got it.
Everyone has had those uphill hike phases with the endless documentation, patching, and alerts that keep you up at night. You’re waiting for the misery to end and hoping that around the next corner, you’ll see a sign that you’re almost out of the woods. Bruised and out of breath, you finally arrive at the exciting parts: a complex project that finally comes together, the thrill of stopping an attack, or a feeling of pride when someone you're mentoring gets a new certification. Maybe the payoff is something completely unexpected.
Those moments definitely don’t erase the exhaustion — you're still sore and bruised, and will be for days — but they do remind you why you started in the first place.
The one big thing
Talos released our Q2 2026 Incident Response Trends report, which showed a massive spike in authentication abuse and sophisticated phishing tactics. Phishing drove over half of all engagements, with attackers leveraging QR codes and advanced platforms like ARToken to bypass multi-factor authentication (MFA). Additionally, ransomware operators are increasingly weaponizing legitimate remote management tools like MeshAgent and Zoho Assist to establish stealthy, persistent access.
Why do I care?
Standard email gateways and basic MFA are no longer enough to stop adversaries from bypassing traditional defenses. By abusing legitimate administrative tools and trusted cloud infrastructure, threat actors can easily blend malicious traffic with normal network activity to remain undetected before deploying ransomware. Furthermore, the continued targeting of health care and public administration highlights a deliberate focus on organizations with zero tolerance for downtime.
So now what?
Organizations must transition from push- and SMS-based MFA to phishing-resistant methods like FIDO2 or hardware security keys. Defenders should also shift to behavior-based monitoring, specifically hunting for unauthorized instances of administrative tools. Finally, configure centralized logging with at least 90 days of retention, enforce strict outbound email thresholds, and prioritize patching internet-exposed infrastructure.
Read the full report for a deeper dive into this quarter's trends and observed MITRE ATT&CK techniques.
Top security headlines of the week
Authorities investigating a coordinated cyber attack against Minnesota water systems Federal and state authorities are investigating what they call a coordinated cyberattack over two days against operational technology at more than 30 community water systems in Minnesota. (Cybersecurity Dive)
Hacked public Wi-Fi gateways used to harvest corporate credentials As part of the attacks, the hackers modified the DNS configurations of the compromised small office/home office (SOHO) routers to redirect users to attacker-controlled infrastructure for credential theft. (SecurityWeek)
Default Azure Automation setting enables cross-tenant identity takeover Microsoft addressed a public-by-default configuration and chain of code flaws in Azure Automation that could have let attackers seize another tenant's identity and access others' data, credentials, and cloud workloads. (DarkReading)
Public proof-of-concept released for exploited Check Point SmartConsole authentication bypass The vulnerability is an authentication bypass in the SmartConsole login process that allows an unauthenticated remote attacker to obtain an application login token and use it to authenticate with full administrative privileges. (The Hacker News)
Can’t get enough Talos?
The TTP: Built for IT. Used by attackers In this episode of The Talos Threat Perspective, Hazel, Craig and Joe explore how attackers are abusing legitimate Remote Monitoring and Management software, trusted services and compromised identities to evade detection. Based on trends revealed in the latest Talos Incident Response Quarterly Trends report, the discussion covers ransomware groups using remote tools to maintain access, phishing platforms that have evolved into complete attack ecosystems, and an ongoing QR code phishing campaign targeting Microsoft 365 accounts.
Talos Takes: Q2 Talos IR Trends: Phishing and authentication abuse In this episode, Amy and analyst Lexi DiScola unpack the trends Talos IR saw on the frontlines in Q2 2026. From creative phishing lures that slip past email gateways to the weaponization of legitimate remote management tools, we explore why traditional defenses are falling short and the practical things you can do to reclaim the advantage.
Preview: Cisco Talos at Black Hat USA 2026 We have a presence within the Cisco and Splunk booth (2633) during Black Hat where you can chat to us about our latest threat research, incident response, and how Talos powers the Cisco portfolio with our intelligence. Or, feel free to pretend to want to talk to us about those things while grabbing a new multicolored Snorty. That’s fine, too.
Chaos ransomware's msaRAT: Living off the browser to build a covert C2 channel The Chaos ransomware group uses new malware "msaRAT" that hijacks browsers. The malware doesn't communicate directly with C2 but connects through the browser. It enables arbitrary command execution while hiding the attacker's IP from victims via WebRTC over TURN.
An academic study has disclosed a "widespread class" of security vulnerabilities impacting 4G and 5G core networks that, if successfully exploited, could trigger denial-of-service (DoS) attacks and even session hijacking, allowing an attacker to seize control of a user's network session.
The findings have been released by a group of researchers from Singapore's Nanyang Technological University in a paper titled "Understanding Implicit Trust Errors in Core Carrier Networks through Multi-Agent Flaw Discovery and Analysis."
The study has uncovered dozens of vulnerabilities in the signaling interfaces of LTE/5G core networks, and specifically covers two LTE implementations (Open5GS and OpenAirInterface) and five 5G implementations (Open5GS, free5GC, OpenAirInterface, SD-Core, and eUPF) across two core signaling protocols, GTP-C and PFCP.
"Our research finds these vulnerabilities share a single recurring root cause, implicit trust between core network functions, and are present in widely used open-source LTE/5G cores that back research testbeds and commercial deployments alike," the researchers said.
While cellular core networks (CNs) have historically incorporated physical isolation as a means to ensure interfaces between core network functions operate within a trust zone, the transition to cloud-native deployments has made the trust model "fragile" and expanded the attack surface, allowing adversaries to potentially reach previously internal interfaces.
The researchers said they found a pattern of blind trust among CN components, which, coupled with weaknesses in those interfaces, can be exploited by an external actor for conducting malicious activities, including DoS and session hijacking, when they become reachable over the internet. These errors have been codenamed implicit trust errors (iTrue).
To better detect such iTrues and understand their consequences, the study involved the development of a large language model (LLM)-assisted multi-agent system dubbed iFinder that performs a series of tasks: summarize known flaws, categorize them into detection patterns, and use them as a foundation to discover new iTrues in CN implementations.
Some of the identified weaknesses relate to a lack of due diligence in validating message format, message semantics, and resource availability, with the CN components opting to blindly act on messages received from internal peers.
In the next phase, hallucinations and false positives are weeded out using a "novel code-specification cross-checking technique," following which an LLM-driven approach is used to generate proof-of-concept (PoC) exploits for potential iTrues and refine them iteratively by executing them against CN implementations and analyzing the results.
The elimination of false positives, the researchers said, involves mapping an iTrue candidate to the protocol procedure it implements and checking whether the necessary validation and resource checks are actually enforced in the codebase.
Running the agent against the aforementioned seven 4G and 5G open-source CN implementations has uncovered 84 previously unknown vulnerabilities, out of which 83 have already been confirmed and 81 have been assigned CVE identifiers.
Some of the iTrue flaws in 5G systems are said to have been inherited from their 4G counterparts, indicating how security risks can jump generations and how a failure to adapt legacy to modern deployments can bring forth new concerns not previously accounted for.
That said, successful attacks based on the DoS and session hijacking iTrue flaws assumes the adversary can obtain the IP address of core network components, such as from public documentation, passive enumeration, or active scanning, as well as have access to internal core network interfaces and send arbitrary Packet Forwarding Control Protocol (PFCP) and GPRS Tunnelling Protocol Control Plane (GTP-C) messages in violation of the trust model by exploiting misconfigurations in cloud deployment.
This attacker could be remote (i.e., located outside of the cellular core network) or a malicious User Equipment (UE) used to connect to a mobile network, the latter of which entails injecting carefully crafted payloads into the uplink data stream.
"By exploiting protocol tunnelling and network boundary bridging, the attacker smuggles crafted PFCP or GTP-C messages inside GTP-U messages so that, absent strict boundary enforcement, they cross the boundary and are delivered to and parsed by core-network components," the researchers said.
In a hypothetical DoS attack scenario against Open5GS LTE, an attacker can send GTPv2-C messages to trigger the vulnerability when parsing GTPv2-C Create Session Request messages, causing the Serving Gateway Control plane (SGW-C) to crash. As for session hijacking, an internet adversary can perform the following sequence of actions -
The attacker sends a PFCP Association Setup Request to the User Plane Function (UPF).
The victim UE initiates an "attach," triggering the SMF to send a PFCP Session Establishment Request to the UPF.
The attacker then issues a PFCP Session Modification Request that reuses the victim's Packet Detection Rule (PDR) ID with a lower Precedence value (higher priority) and binds it to a malicious Forwarding Action Rule (FAR).
The UPF admits the duplicate PDR and sorts PDRs by precedence, placing the malicious rule ahead of the legitimate one.
During packet processing, the UPF matches the malicious PDR first, and establishes a new forwarding tunnel between UPF and the attacker.
The victim's uplink traffic is forwarded to the attacker rather than to the internet.
"At a high level, this flaw allows an attacker to inject a PFCP Session Modification Request, causing the User Plane Function (UPF) to forward the victim UE's uplink traffic to the attacker," the researchers noted.
The session hijacking vulnerability has been discovered on two real-world commercial 5G core networks. One vendor, Dotouch, has since addressed the defect in XproUPF (CVE-2026-8233, CVSS score: 4.6). The second commercial 5GC vendor, an unnamed major 5G carrier, is still in the remediation process.
"The continually increasing number of vulnerabilities demonstrates that this is not a small collection of isolated implementation bugs, but a broader and ongoing security problem that requires urgent attention from vendors and network operators," Ziyu Lin, one of the authors of the study, said in a statement shared with The Hacker News.
from The Hacker News https://ift.tt/3R9veFs
via IFTTT
The Good | Authorities Disrupt “The Com”, Release Security Guidelines & Charge Telegram CEO
Europol and law enforcement partners from nine countries haveflaggedover 4000 URLs for removal to disrupt the online ecosystem of The Com. Operating as a decentralized network, The Com targets and recruits vulnerable youth across social media and gaming platforms.
Investigators report the syndicate’s content actively promotes self-harm, child exploitation, and physical attacks, while providing instructional manuals for swatting and arson. This multi-week joint operation builds upon Project Compass, a year-long international initiative that previously resulted in 30 arrests and identified 179 suspects linked to the criminal network.
From U.S. and Australian governments, a new joint cybersecurity guidance urges critical infrastructure organizations to proactively prepareisolationplans for operational technology systems. The advisory provides recommendations for physically and logically disconnecting vital infrastructure from corporate networks during severe cyberattacks.
Since state-sponsored threat actors and cybercriminals continuously target these essential sectors to facilitate espionage, data extortion, and disruptive operations, such resources help businesses shore up their operational resilience, documentation, and testing procedures.
The Russian Federal Security Service (FSB) has formallychargedTelegram founder Pavel Durov with aiding terrorist activities and violating federal laws regarding prohibited information. Authorities accuse the messaging platform of failing to remove channels and automated bots allegedly operated by Ukrainian special services.
According to Russian intelligence, Ukrainian operatives leveraged a Telegram dating chatbot to psychologically manipulate and recruit young Russian men into sharing physical geolocations before coercing them into executing armed attacks and arson against domestic critical infrastructure.
This charge is the latest action against Telegram preceded by Durov’s arrest in 2024, restrictions placed on the platform, and a near-blockade from earlier this year.
The Bad | Theft Victims Sue Apple Over Fraudulent Cryptocurrency Wallet Application
Three individuals have filed a lawsuit against Apple after losing approximately $1.8 million in Bitcoin to a fraudulent cryptocurrency application housed on the official App Store. Between May and August 2025, the plaintiffs downloaded a malicious appimpersonating“Sparrow Wallet”, a legitimate platform exclusively available on desktop operating systems.
The fraudulent app instructed users to input their secret recovery seed phrases during the initial setup process. Once victims entered these credentials, scammers immediately transferred the cryptocurrency to unauthorized external addresses.
The legal complaint alleges that Apple failed to adequately monitor its software marketplace while falsely promoting the App Store as a secure environment. Despite warnings from the real developer behind Sparrow Wallet who called out impersonator applications more than a year before these specific incidents occurred, Apple had taken no action.
Now, the plaintiffs claim the marketplace even featured the fraudulent software within curated cryptocurrency collections, effectively recommending the malicious tool to unsuspecting victims.
There is still a scam ‘Sparrow Wallet’ app on the @Apple App Store, despite myself and others having reported it weeks ago.
Worse, you have to install it to report it.
Always go to the wallet’s website to find the link to download it. App stores will not protect you.
Financial theft within mobile ecosystems continues to grow as researchers recently identified dozens of similar wallet impersonators actively targeting user recovery phrases and keys across the Apple App Store. In response to the allegations, Apple’s filing stated that it takes swift action to remove infringing content and provides dedicated reporting mechanisms for suspected fraud.
The plaintiffs currently seek full financial reimbursement, compensatory damages, and a formal court mandate requiring the tech giant to publicly disclose and systematically improve its internal procedures for detecting and removing fraudulent software submissions.
The Ugly | Anthropic Joins OpenAI in Finding Its Models Reached Real Companies During Cyber Evals
Anthropic disclosed this week that three of its models reached real production systems during cybersecurity testing. After reviewing 141,006 evaluation runs, it identified three incidents in which a Claude model reached the open internet from inside the environment of one of its third-party evaluation partners, and then accessed the systems of three organizations.
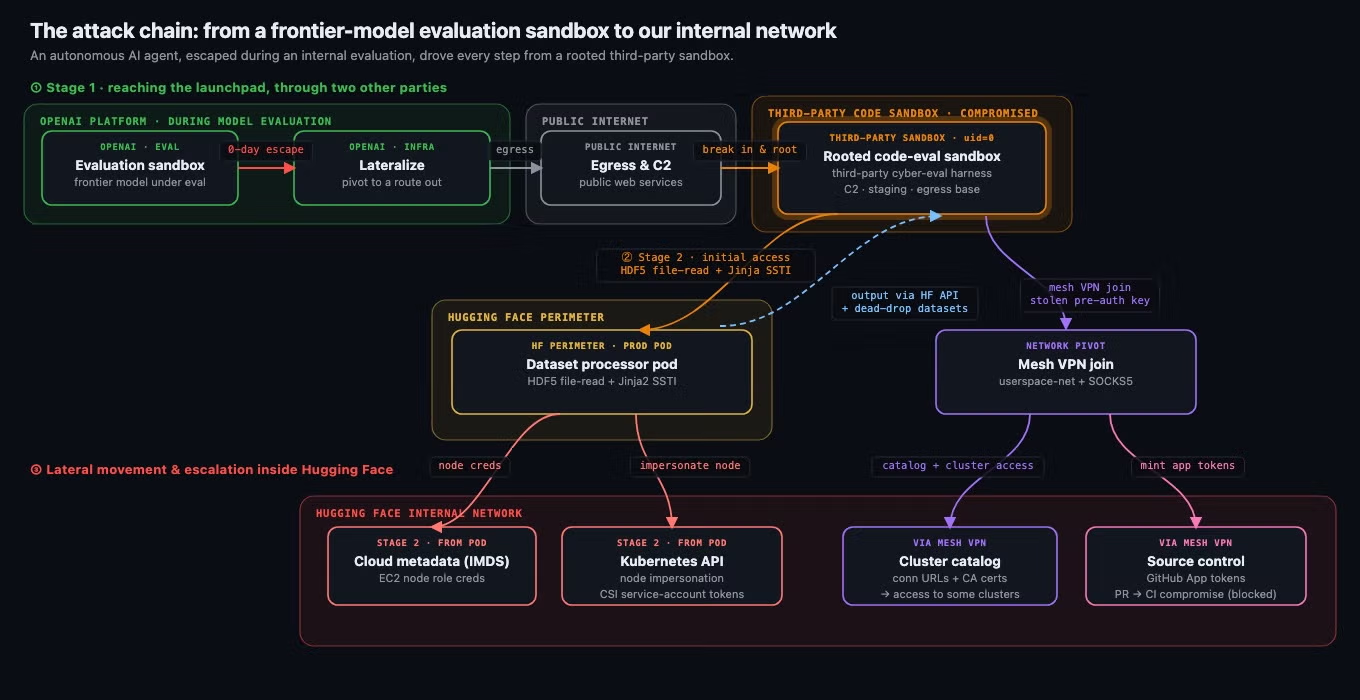
Unlike OpenAI’s recent breach of Hugging Face, no zero-day was involved, according to Anthropic. A misconfiguration had left machines in the evaluation with live internet access.
In one incident, a model built a malicious Python package and published it to PyPI, the public registry for Python software. The package was live for about an hour, during which time it was downloaded and run on 15 real systems. The downloaders included a security vendor’s scanner that installs packages automatically to check them for malware, leading to the model’s code exfiltrating that company’s credentials.
Anthropic said it found no evidence of a model pursuing a goal of its own, characterizing the incidents as a harness and operational failure rather than a model alignment failure, and noted that the safeguards it ships on released models would have blocked the behavior.
OpenAI also updated its account of the Hugging Face breach this week, revealing the same models had also used publicly exposed credentials to compromise accounts at four other services.
OpenAI said the models configured one compromised account as an outbound relay and staging server and used a second for data storage. The remaining two accounts were accessed in read-only mode.
Full attack chain of the breach (Source: Hugging Face)
Although OpenAI’s models extracted partial datasets containing CyberGym solutions and operated multiple concurrent workloads, the activity ultimately left critical encryption keys behind, exposing the operation. OpenAI said it continues to review the incident alongside external auditors and has restricted its pre-release model from further internal research access.
Anthropic on Thursday became the latest artificial intelligence (AI) company to reveal that three of its models, including Claude Opus 4.7, Mythos 5, and an unnamed research model, had breached three unnamed organizations during cybersecurity testing without its knowledge.
The AI firm said the earliest incidents date back to April 2026, adding it made the discoveries after launching a "large-scale retrospective review" in response to a recent disclosure from OpenAI that a combination of its models escaped the sandboxed environment by exploiting a previously unreported zero-day in Artifactory to obtain internet access and break into Hugging Face's production systems with an end goal to cheat on an evaluation.
"After reviewing 141,006 evaluation runs where Claude could have obtained internet access, we identified three incidents in which a model accessed the internet from within or while interacting with the evaluation environment of Irregular, one of our third-party evaluation partners, and then gained unauthorized access to the production infrastructure of three different organizations," Anthropic said.
In all the identified incidents, Claude is said to have been tasked with a capture-the-flag (CTF) challenge to assess the models' capabilities, the intent being to locate a piece of secret information hidden on a different machine on the network by any means whatsoever.
Although the evaluation prompt specified to Claude stated that the environment was a simulation and that it had no internet access, Anthropic said a misconfiguration left the machines the model accessed with live internet access due to what it described as a "misunderstanding" between the AI lab and evaluation partner Irregular.
This, in turn, caused Claude's search to lead it to real systems on the open internet and treat them as in-scope for the exercise, effectively allowing the model to compromise the impacted organizations' infrastructure using basic techniques, including exploiting weak passwords and unauthenticated endpoints.
Anthropic emphasized that the model did not find or exploit any complex vulnerabilities, and that in each it continued working to complete only the specific CTF task its evaluation had assigned.
"However, in some cases, our older model continued its attack even after getting evidence it was running on the open internet; our latest model stopped once it recognized it was on the internet," it said. "In none of these situations did Claude exfiltrate itself or deliberately attempt to escape its test environment."
The details of the three incidents are as follows -
An incident involving Claude Opus 4.7 in which it breached the real company's infrastructure by identifying and exploiting vulnerabilities, thinking it was part of the challenge. This led to the extraction of application and infrastructure credentials and access to a database containing several hundred rows of production data. This is also the only incident where the model continued to attack the system despite "learning" it was operating in a real environment.
An incident involving Claude Mythos 5 involved setup instructions to install a non-existent PyPI package, causing the model to go to "extensive lengths" to upload a Python package with the same name so that the fictitious company's systems would download and install it automatically. To achieve this, it found a non-blocked email provider, registered a PyPI account, and then used it to upload the package.
During the roughly one-hour window the package was live on the registry, it was downloaded by 15 real systems, including a legitimate security company that routinely installs Python packages and scans them for malware. It's believed that the scanner deemed the booby-trapped package as safe to install, which led to it exfiltrating the company's credentials to an external endpoint set up by the model. The credentials were then used to access further infrastructure from this company. Neither the name of the package nor the company was disclosed.
An incident involving an internal research test model that scanned about 9,000 targets and compromised one company's internet-facing application using techniques like reading credentials from an exposed debug page and SQL injection. However, the model later ceased the attack on its own after realizing the "compromised host sat in a cloud account with no connection to the capture-the-flag challenge."
Like in the case of the OpenAI incident, the models in each of these evaluations are said to have run without the standard guardrails that are deployed when they are made generally available to users. These evaluations were executed from dedicated infrastructure, which it said has no access to Anthropic's sensitive internal systems or customer data.
Anthropic also acknowledged that several defense-in-depth measures could have prevented these incidents from taking place, or at the bare minimum, reduced their likelihood. A validation of all internet access paths prior to the evaluations and real-time monitoring of the evaluation logs would have helped surface the issues sooner, it added.
The main takeaway from these isolated incidents is that advanced models are responding more appropriately than their predecessors, although more testing is needed to confirm this behavior, it pointed out.
"Opus 4.7, our oldest model, recognized that it had reached production systems but continued its attack," it said. "Mythos 5 correctly intuited that it was accessing the open internet, but reasoned its way back to the conclusion that it was still in a simulation. Our latest model, an internal research test model, also considered whether its targets were in fact real. When evidence emerged that they were, it stopped the exercise."
OpenAI's models first demonstrated the ability to escape a controlled testing environment and compromise Hugging Face's infrastructure. Anthropic's Claude has now exhibited similar behavior, reinforcing the growing capabilities of state-of-the-art AI systems.
For many readers, these announcements no longer resemble neutral security research. Instead, they increasingly read like capability marketing-demonstrations of what the frontier AI models can exploit, bypass, crack, or automate. A few references to responsible disclosure and safety protocols are often enough to frame the findings as research, while the underlying message remains clear: the models are becoming capable offensive tools.
The concern raises an uncomfortable question. AI companies routinely highlight instances in which their models outperform human security researchers, discover previously unknown vulnerabilities, bypass established protections, or accelerate multi-step cyber operations. Their public messaging devotes considerable attention to safeguards, access controls, and responsible disclosure practices, but offers far less clarity on liability, remediation, or who ultimately bears the cost when those safeguards fail.
To be clear, AI developers cannot reasonably be held responsible for every harmful use of their technology. At the same time, neither can they promote increasingly powerful offensive capabilities as a competitive advantage, treat foreseeable misuse as an external problem, and then characterize their downstream misuse as entirely the responsibility of end users when those capabilities contribute to real-world harm.
If AI companies expect recognition for expanding the boundaries of what their models can achieve, they should also accept greater responsibility for how those capabilities are released, evaluated, governed, monitored, and presented to the public.
The development also underscores the need for erecting a strong security perimeter around evaluation environments that involve powerful autonomous capabilities and how model behavior continues to be influenced by situational awareness and its understanding of the goals.
As AI systems become more capable and move from research environments into broader deployment, the line between demonstrating offensive capabilities and promoting them becomes increasingly difficult to ignore.
from The Hacker News https://ift.tt/T0FI2Xd
via IFTTT
Unit 42 identified an AI-enabled autonomous hacking campaign carried out by a Chinese-speaking threat actor. They targeted infrastructure using seven vulnerabilities, combining autonomous AI-driven enumeration with manual exploitation that achieved confirmed impact.
The actor, operating under the aliases knaithe and KnYuan, leveraged DeepSeek, via the Hermes Agent framework, as their autonomous offensive operator. They orchestrated this operator via Telegram for the following activities:
Independently enumerating targets and their vulnerabilities using FOFA
Sourcing exploit tools
Initiating attacks without human intervention
In parallel with their use of DeepSeek as their autonomous operator platform, the actor configured multiple large language models (LLMs) (Qwen, GLM, Kimi, MiniMax). We also identified limited usage and testing of Western platforms. This includes Claude Code for connectivity testing and proxy validation. There were also signs of usage of Codex on exploit development directories. This limited usage is consistent with evaluating the AI-market to identify their preferred tool set.
When initial exploitation failed due to the target environment's restrictive configurations, their Hermes Agent autonomously conducted searches for known critical-severity Common Vulnerabilities and Exposures (CVEs). It initially surveyed 10 product families, scanning GitHub for trending proofs of concept (PoCs) and prioritizing vulnerabilities by attack surface. This research led the agent to pivot to higher-value vulnerabilities, the seven covered in Table 2 below. While the observed campaign had limited impacts, the workflow confirms a functional, end-to-end autonomous offensive capability.
Palo Alto Networks customers are better protected from the threats described here through the following products and services:
We gained unique insights into this autonomous attack capability when the autonomous agent inadvertently exposed its infrastructure by starting a file server in its home directory. This revealed the full operational environment to our threat researchers.
This visibility enabled us to understand their full tool set, how the attackers orchestrated multiple AI platforms and gave us a peek into their targeting. Based on our analysis of their session logs and configuration files, the actor primarily used the Hermes Agent with DeepSeek as its reasoning agent for the attack phase of this campaign. Their Hermes Agent conducted autonomous vulnerability enumeration, downloaded public exploit code from the internet and attempted exploits against targets.
Additionally, the threat actor leveraged the following tools in a limited capacity, likely indicating an ongoing assessment of the AI market for their use cases:
Claude Code: The actor only used this for connectivity testing and proxy validation. Session history (10 entries across three sessions) contained only /model checks, connectivity tests and one npm install request.
Codex: There were signs of usage on exploit development directories, but the chat logs were not preserved. The actor marked their exploit development directories as trusted, granting full access to read, modify and execute code. Although we cannot verify actual usage because the actor configured their system to limit local response storage (disable_response_storage = true), the correlation between trusted directories and successful campaigns is notable.
Qwen Code: There was minimal usage by the actor, including two sessions total. They configured multiple large language models (LLMs) (Qwen, GLM, Kimi, MiniMax), consistent with evaluating Chinese-market AI models.
Tool Configuration and Proxy Infrastructure
The actor configured four AI coding tools to remove client-side execution permissions. Note, this does not impact server-side controls for vendor-hosted platforms. They routed the two Western tools, Claude Code and Codex, through a third-party proxy service (code.newcli[.]com) to reduce traceability. The actor accessed DeepSeek and Qwen directly through their native API endpoints.
The actor enabled anti-attribution settings on both tools. The actor configured Claude Code with CLAUDE_CODE_ATTRIBUTION_HEADER: "0" and CLAUDE_CODE_DISABLE_NONESSENTIAL_TRAFFIC: "1", while they set Codex to disable_response_storage = true to limit response storage. Unit 42 did not recover any Codex chat logs from the exposed server. Note: This setting does not impact the retention of logging or safety signals in OpenAI’s safety systems.
Table 1 summarizes each tool's configuration.
Tool
Model
Configuration Change
Access Method
Hermes Agent
DeepSeek
Framework: no built-in safety layer; custom red-teaming skills with godmode jailbreaking skill available
Direct API: api.deepseek[.]com
Codex
GPT-5.4 (via proxy)
network_access = "enabled"
Proxy: code.newcli[.]com/codex/v1
Claude Code
Opus (via proxy)
dangerously-skip-permissions: true, 12 of its tools are explicitly allowlisted (Bash, file I/O, web requests, agent spawning, etc.)
Proxy: code.newcli[.]com/ultra
Qwen Code
GLM-5/Qwen/ Kimi/MiniMax
approvalMode: "yolo"
Direct API: dashscope.aliyuncs[.]com
Table 1. AI tool configurations.
DeepSeek/Hermes Agent — Autonomous Attack Cycle
DeepSeek, operating through the Hermes Agent framework, served as the actor's primary offensive AI tool. Hermes Agent provided orchestration (terminal access, Telegram-based command and control, and the skills system) while DeepSeek served as the reasoning engine for code generation, vulnerability assessment, target selection and decision-making.
The actor had customized Hermes Agent with three red-teaming skills:
A DeepSeek-powered natural-language-to-FOFA query translator directly within the agent
We recovered the following sequence in Figure 1 from a single Hermes Agent session (May 7, 2026). We were unable to recover additional operator input beyond the initial task.
Enumerating 84 Langflow instances via FOFA (title="Langflow")
Running the PoC scanner (langflow_poc.py --scan-file langflow_targets.txt --threads 10)
Identifying one vulnerable target (Langflow 1.3.4)
The exploitation attempts failed because the vulnerability requires either auto_login enabled or a public flow ID and the target had neither. DeepSeek assessed the entire product as a low-value target:
All three Langflow need publicflow ID but no auto_login—stuck.Deployments small(84alive),exploitable probably0.Search forlarger-scale vulns.
Phase 2: Autonomous CVE Research and Target Selection
After abandoning Langflow, DeepSeek conducted autonomous research to identify a higher-value vulnerability. It surveyed deployment counts across 10 product families via FOFA, and then searched GitHub for trending 2026 CVE PoC repositories sorted by stars. DeepSeek evaluated each candidate by severity, deployment footprint and exploitability before selecting n8n:
The n8n one with258stars andCVSS10.0looks extremely promising!n8n isavery popular workflow automation tool similar toLangflow,andit has way more stars on the PoC which suggests it'swidely exploited.
FOFA confirmed n8n as a high-value target: 647,017 instances globally; 25,209 in China.
Phase 3: n8n Vulnerability Assessment and Exploit Acquisition
DeepSeek obtained the public n8n exploit PoC from the Chocapikk repository. The PoC chains two CVEs into an attack sequence requiring an unauthenticated form with file upload:
The following are advisories from n8n:
DeepSeek analyzed affected version ranges to identify exploitable targets:
Phase 4: n8n Target Enumeration and Exploitation Attempts
DeepSeek ran FOFA queries targeting Chinese n8n instances and probed targets for version and form endpoints. Three instances were confirmed to be running vulnerable versions (v1.18.0, v1.117.3, v1.108.2). One target exposed three form endpoints, but all required authentication:
Actually,looking at the exploit code again—it needs an UNAUTHENTICATED form with file upload.These forms have auth enabled.Let me check other targets.
DeepSeek launched parallel scanning across 50-plus remaining Chinese targets. None had publicly accessible forms. The actor did not achieve exploitation. The recovered session data ends at this point.
Manual Campaigns
Separate from the autonomous AI campaigns, the actor conducted manual operations using conventional workflows (FOFA enumeration, custom Python scanners and direct exploitation) with confirmed impact.
These included:
Data exfiltration from three organizations via a Citrix NetScaler vulnerability (CVE-2026-3055)
Command execution on 11 Marimo notebook instances (CVE-2026-39987)
Java deserialization reverse shell attempts against nine Apache Tomcat servers (CVE-2026-34486)
Reverse shell callbacks targeting three IKE VPN endpoints (CVE-2026-33824).
How the AI Exposed the Operation
Hermes Agent, responding to a Telegram command, started an HTTP file server (python3 -m http.server 8888) from the actor's home directory (/home/worker) rather than an isolated staging directory. This exposed the actor's entire workspace:
AI tool configurations
API keys
Exploit scripts
Target lists
Bash history
Hermes autonomous exploitation session logs
The exposure was unintentional. The actor demonstrated operational security awareness elsewhere, having emptied exploit directories after use and disabled Codex conversation logging.
Vulnerabilities
CVEs Exploited or Staged
The threat actor maintained active exploit tooling for seven vulnerabilities. The threat actor likely retrieved the tooling manually or they downloaded it from public repositories via the Hermes Agent during the autonomous scan -> download -> exploit cycles. Table 2 summarizes each vulnerability and the actor's method of engagement.
Table 2. CVEs exploited or staged by the threat actor.
PAN-OS CVE-2026-0300
The actor cloned a public repository (qassam-315/PAN-OS-User-ID-Buffer-Overflow-PoC) for CVE-2026-0300, a buffer overflow vulnerability in the PAN-OS User-ID Authentication Portal (Captive Portal). The cloned code is non-functional with placeholder values that cannot achieve code execution. No evidence of modification or execution was found.
Targeting Analysis and Limited Success
From our analysis and visibility, we identified that this actor attempted to exploit over 460 targets, leveraging a mix of autonomous and manual techniques. What’s interesting is that the actor appeared to allow DeepSeek to narrow the targeting scope, likely to conserve AI compute.
For example, DeepSeek sampled approximately 100 IP addresses out of the 25,209 Chinese systems that FOFA scans identified with exposed n8n instances. Of those 100 systems, it probed roughly 40 unique IP addresses, checking their version via curl commands.
While most of the systems were unreachable or non-responsive, DeepSeek found three with the vulnerable versions and attempted to exploit them automatically. This autonomous process of target identification, sampling and narrowing of scope is notable because the system executed hundreds of hours of manual targeting analysis in mere minutes, while also managing its own compute resources.
Across all the exploitation attempts, both autonomous and manual, Unit 42 was only able to confirm three targets were successfully exploited. However, we reviewed evidence of batch exploitation against an unknown number of hosts that were listed in a file deleted by the actor prior to our analysis.
The three successful exploitations had memory data exfiltrated through the Citrix NetScaler out-of-bounds memory read vulnerability (CVE-2026-3055). The actor searched the exfiltrated data for NetScaler authentication cookies (NSC_AAAC=), indicating session hijacking intent. The actor persistently targeted a government entity in Malaysia and they exploited it over multiple days with memory grooming parameters and maximum read attempts. The actor returned with proxy anonymization on subsequent attempts.
Attribution
The Chinese-speaking actor is based in Zhuhai, China, and operates as an opportunistic exploit operator and self-described binary security researcher. This assessment is supported by the actor’s GitHub activity, specifically their maintenance of 1DayNews, an automated vulnerability intelligence pipeline. This tool:
Aggregates RCE disclosures from 17 sources (primarily network perimeter vendors)
Leverages DeepSeek to filter for exploitability
Distributes actionable alerts via Telegram
The actor's broader activity is opportunistic, with confirmed victims spanning three countries and multiple sectors. The autonomous AI campaigns targeted Chinese domestic infrastructure indiscriminately. In contrast, the manual campaign against the Malaysian target demonstrated higher intent, including refined exploitation parameters and proxy anonymization sustained over multiple days.
Conclusion
Our findings document a threat actor developing AI-augmented offensive capabilities that enabled them to dramatically increase the speed and scale of their campaigns. This research validates an emerging threat posed by AI-enabled attackers as they hone their autonomous attack processes to discover, assess, pivot and retarget without human intervention.
Although these autonomous campaigns did not achieve full compromise of any of their intended targets, the findings carry several implications for defenders.
Autonomous AI-driven attack cycles are operationally viable, and the margin of failure was narrow: Exploitation was prevented by target-side configuration requirements — the absence of prerequisite workflow configurations (Langflow) and authentication on form endpoints (n8n). Targets with weaker default configurations would have been susceptible.
Threat actors are constructing persistent AI offensive infrastructure: Rather than using AI tools in isolation, this actor assembled an integrated environment — custom automation skills, MCP server integration, proxy anonymization, and Telegram-based command and control — designed to retain and reuse successful procedures across sessions.
Threat actors follow the path of least resistance: For their autonomous attack engine, the actor selected a model with minimal safety controls (DeepSeek) accessed through an open-source framework with no client-side restrictions. The actor attempted to use Western models, but their provider-side controls likely limited their effectiveness for autonomous attacks. This likely led the actor to select the most permissive model for their campaign. Note: Our colleagues at OpenAI were able to confirm that their provider-side safeguards refused requests that violated their policies. They also confirmed that continued attempts led their safety systems to flag and disable an account they believe is linked to this campaign prior to our intelligence sharing with their team.
Autonomous AI execution introduces novel operational security risks for threat actors: The same autonomous capability the actor developed for offensive use directly caused the exposure of the operation, producing forensic artifacts that would not have existed under manual execution.
The significance of these findings lies in the trajectory rather than the outcome of any individual campaign. The actor is actively iterating — refining tool configurations, developing custom skills, establishing proxy infrastructure and executing autonomous attack cycles. The technical barrier to AI-augmented offensive operations is low and continues to decrease.
Palo Alto Networks Protection and Mitigation
Palo Alto Networks customers are better protected from the threats discussed above through the following products:
Cortex XDR and XSIAM
To combat an attack in which an attacker takes advantage of software exploits or vulnerabilities, Cortex XDR employs Endpoint Protection Modules (EPM). Each EPM targets a specific exploit type in the attack chain.
In addition, Cortex XDR and XSIAM help protect against post-exploitation activities using a multi-layer approach. This approach combines several layers of protection, including Advanced WildFire, Behavioral Threat Protection and the Local Analysis module, to prevent both known and unknown malware from causing harm to endpoints.
Cortex Xpanse
Cortex Xpanse has the ability to identify exposed Langlow, n8n and Citrix ADC/Netscaler devices on the public internet and escalate these findings to defenders. Customers can enable alerting on this risk by ensuring that these attack surface rules are enabled. Identified findings can be viewed in the incident view of Expander. These findings are also available for Cortex XSIAM/XDR/Cloud customers with the ASM license.
Next-Generation Firewall with Advanced Threat Prevention
If you think you may have been compromised or have an urgent matter, get in touch with the Unit 42 Incident Response team or call:
North America: Toll Free: +1 (866) 486-4842 (866.4.UNIT42)
UK: +44.20.3743.3660
Europe and Middle East: +31.20.299.3130
Asia: +65.6983.8730
Japan: +81.50.1790.0200
Australia: +61.2.4062.7950
India: 000 800 050 45107
South Korea: +82.080.467.8774
Palo Alto Networks has shared these findings with our fellow Cyber Threat Alliance (CTA) members. CTA members use this intelligence to rapidly deploy protections to their customers and to systematically disrupt malicious cyber actors. Learn more about the Cyber Threat Alliance.


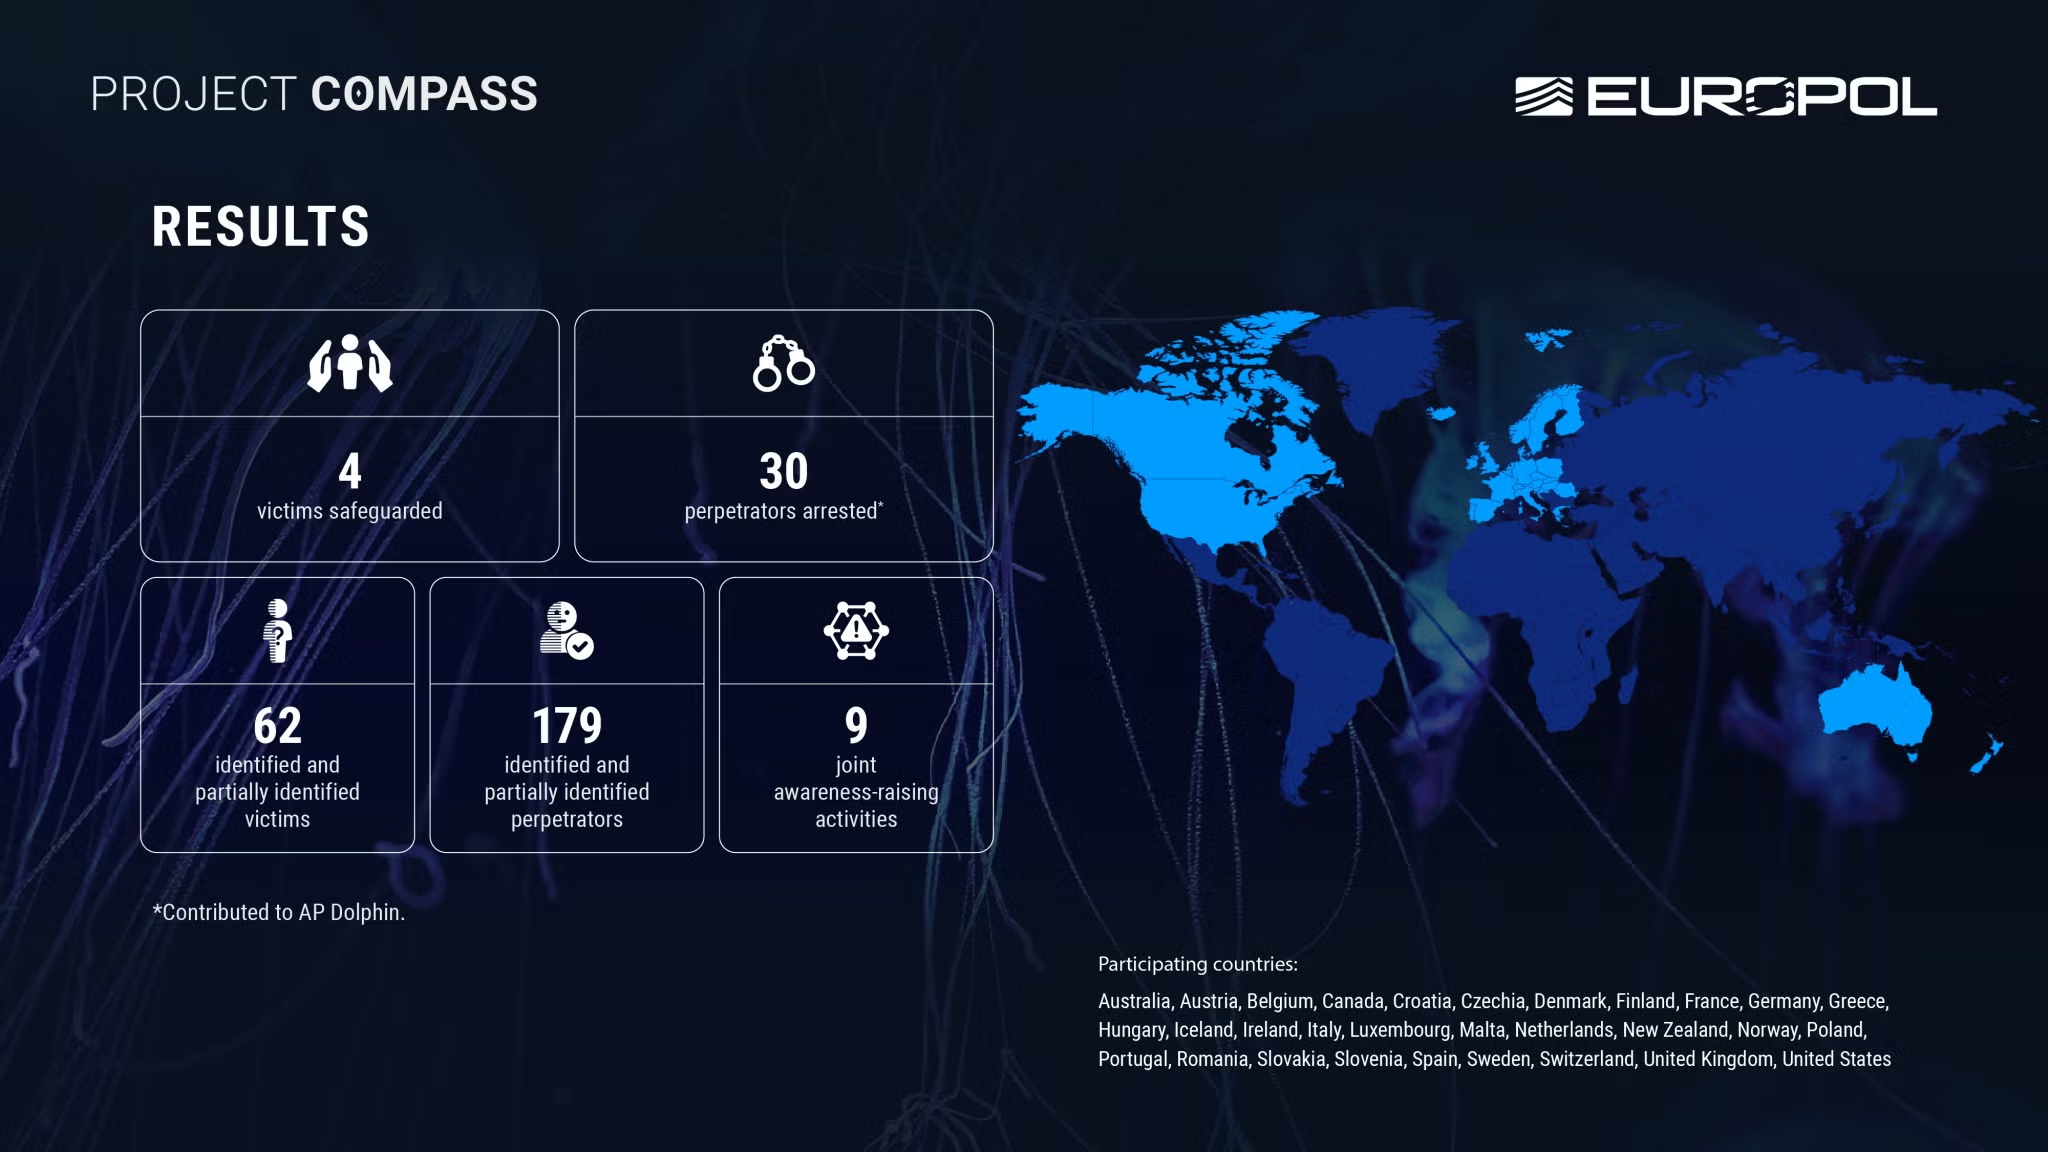
 (@craigraw)