Azure Monitor Log Analytics can collect large amounts of data and it is important to have effective methods to make it easy to visualize it in a simple way. Azure Workbooks are part of the Azure Monitor services and offer a solution to visualize different data sources across your Azure tenant.
Visualizations are great feature of workbooks that provide a rich set of capabilities to show up data:
- Text
- Charts
- Grids
- Tiles
- Trees
- Graphs
- Composite bar
- Honeycomb
- Map
Workbooks use the KQL query language to explore the data. KQL uses schema entities that are organized in a hierarchy like SQLs: databases, tables, and columns. In this article, I will explain how to create Azure workbook from scratch, but I will not go into the details of the KQL language, I will do it in another article.
Getting started
Open the Azure Portal, go to your Log Analytics Workspace, and click Workbooks
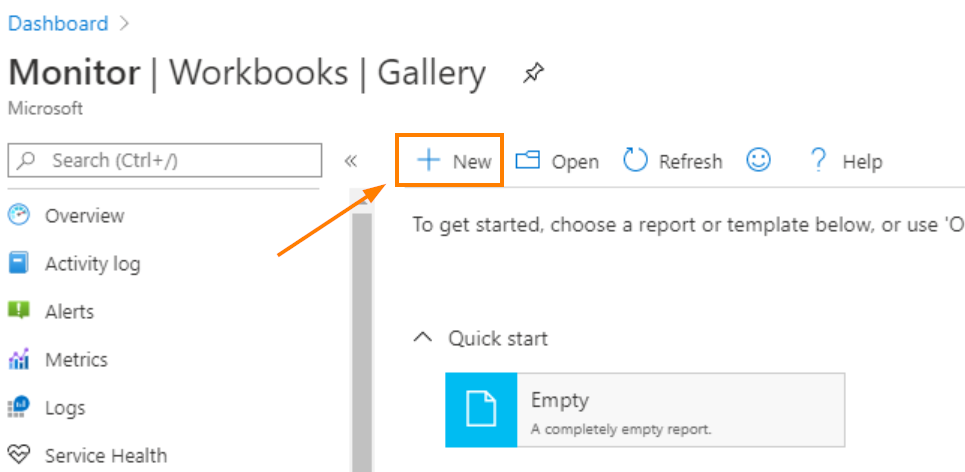
The workbook can be composed of different sections that show graphs, tables, text etc.
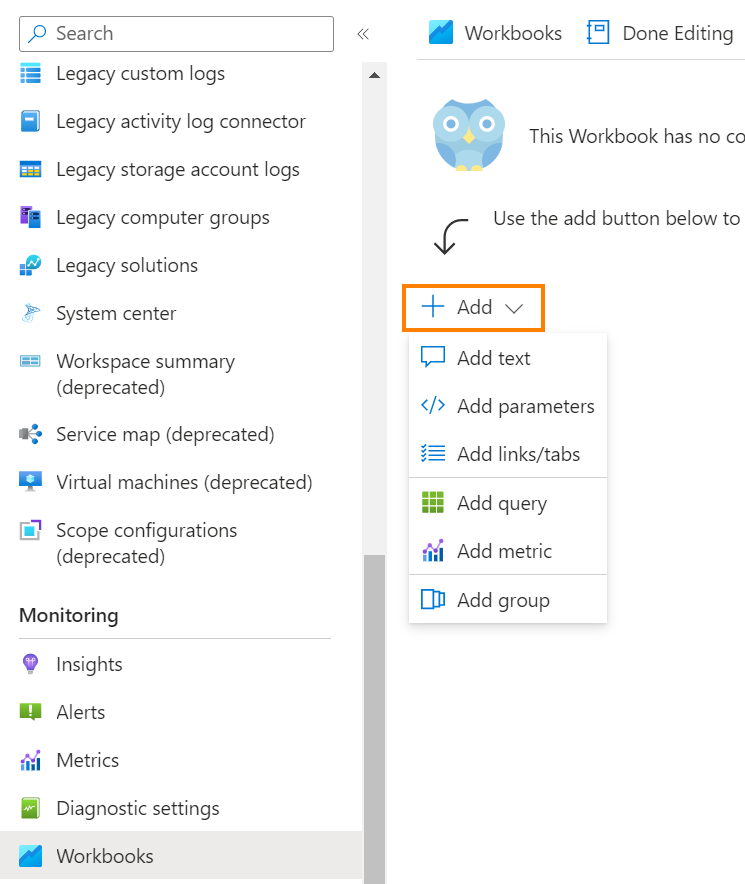
In this example, select “Add text”. A new section appears to write your text using the Markdown language. Once you are happy with your text, you can click “Done Editing”
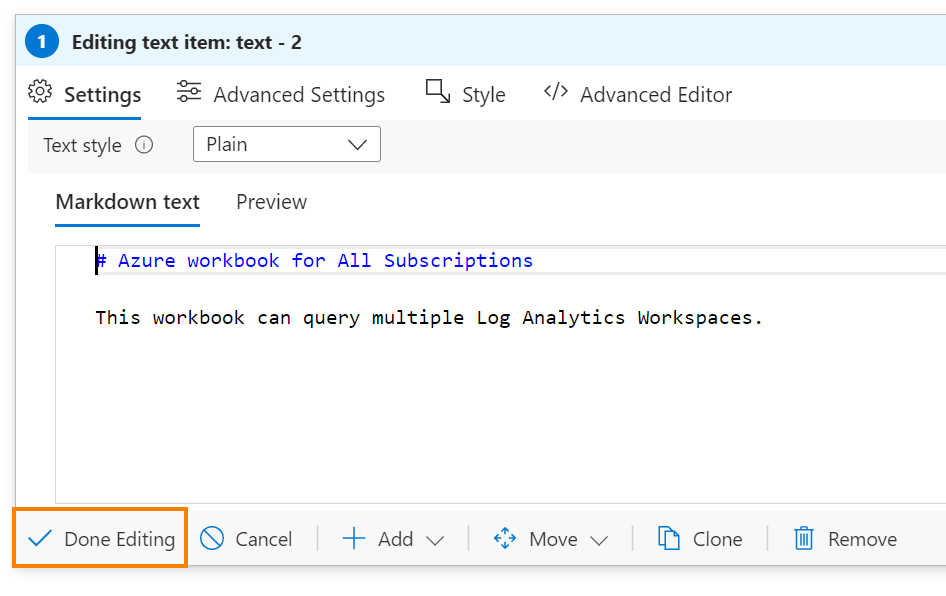
This text section can be used to give information about your workbook. In this example, my workbook will query information across multiple workspaces.

Now, click Add and select Parameters. If you work with multiple subscriptions/workspaces, you probably want to query different workspaces from a single workbook instead of creating multiple workbooks. This parameter will help us to select the desired workspace.
Enter the parameter name and the display name, then edit the parameter:
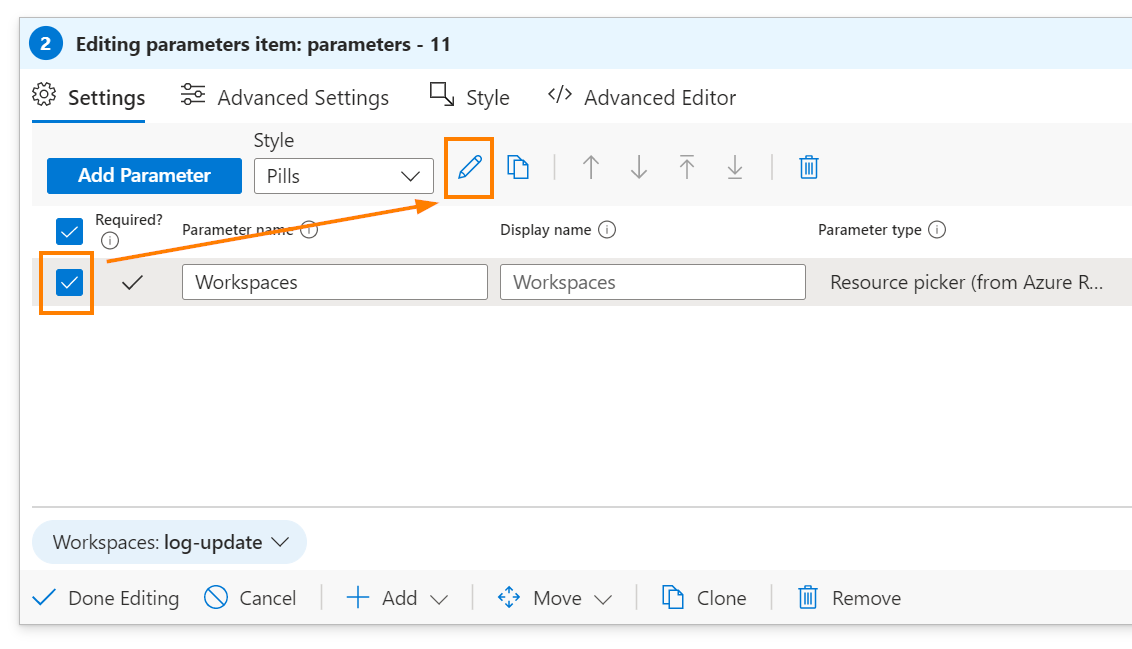
Choose which options are interesting for you, in my case, I selected Required and Allow multiple selections. The important thing is to select parameter type = resource picker.
Then, select Query and enter the following query:
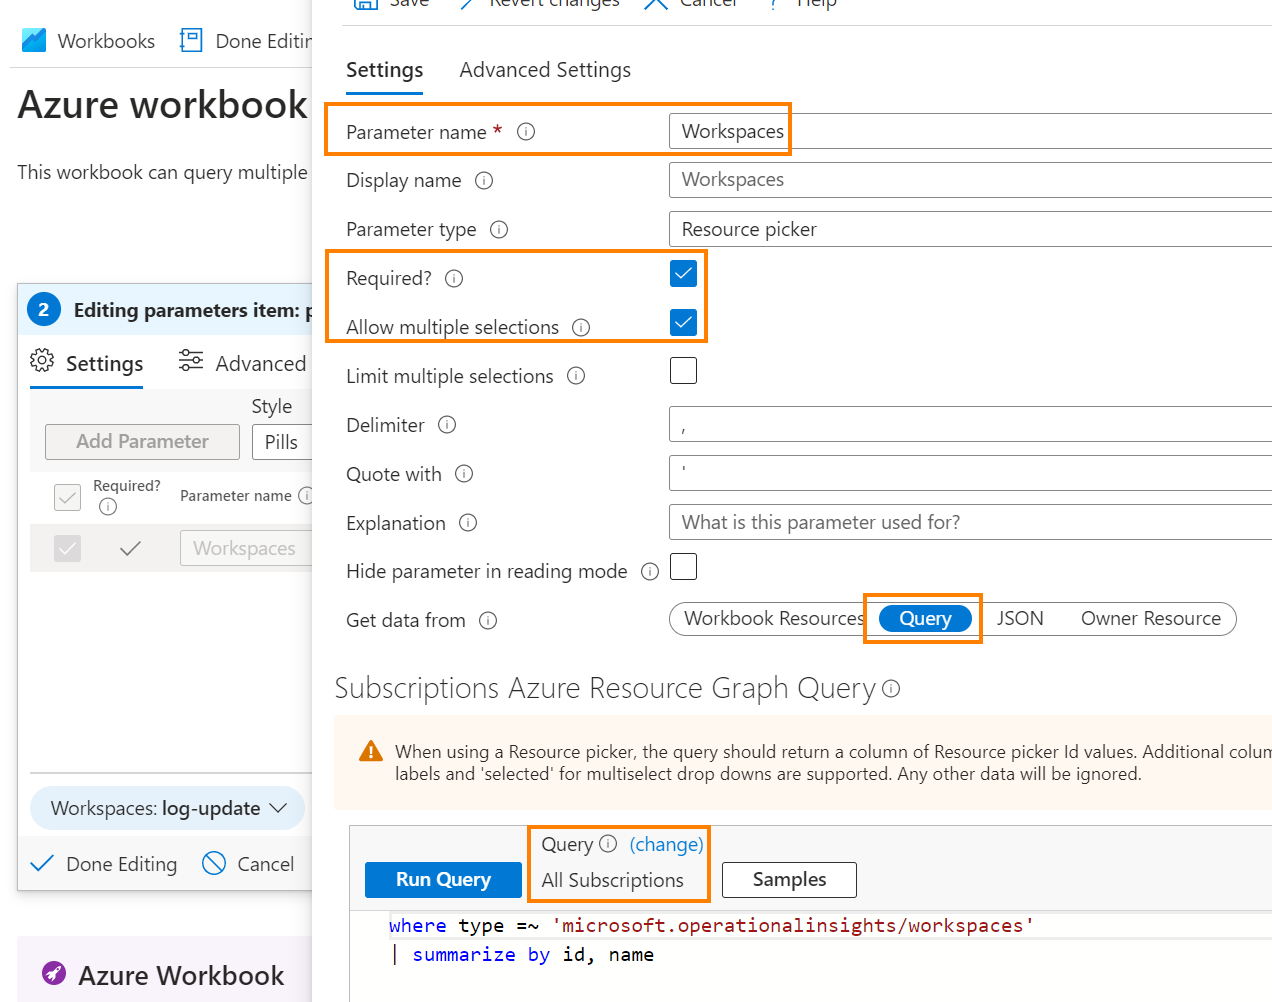
Once you have saved the parameter, you should see the new parameter called “workspace” and you should be able to query multiple workspaces:

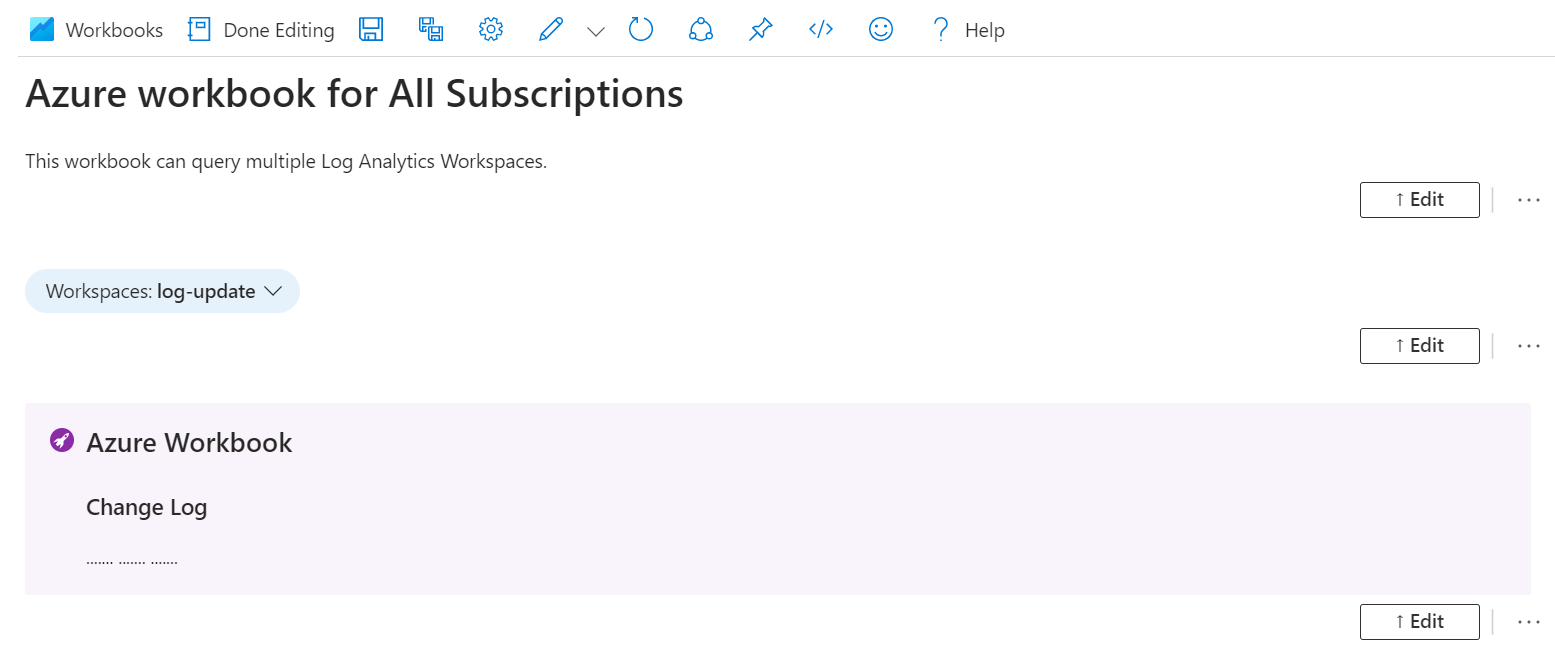
We can add a new text section and select the text style named “Upsell”. That could be interesting for changing log information.
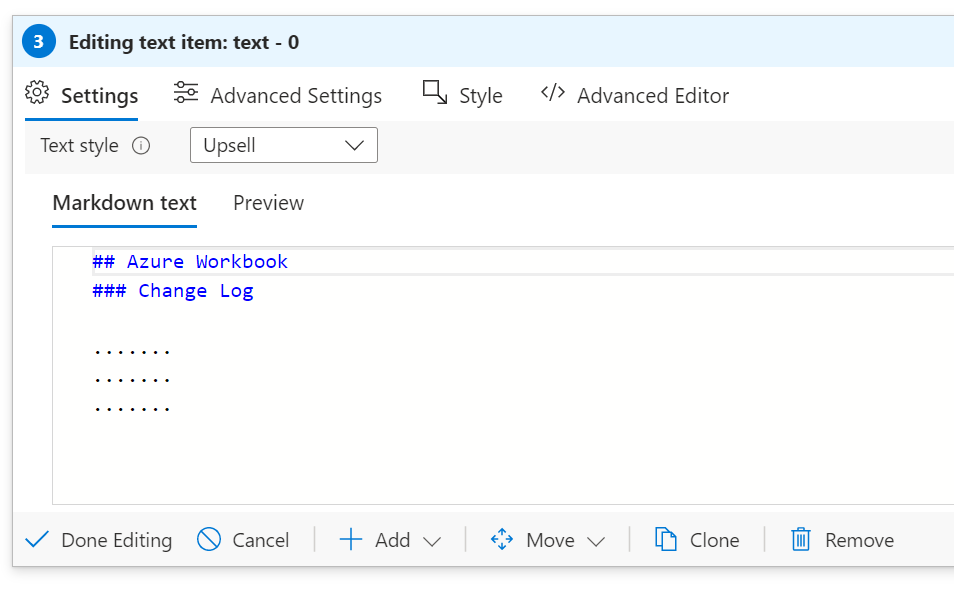
Output should be like the following screenshot:
Now, add a Query and customize the parameters:
- Datasource = logs
- Resource type = Log analytics
- Log Analytics workspace = workspaces (which is the parameter name created previously)
- Time range = Set in query
- Visualization = Pie chart
- Size = large
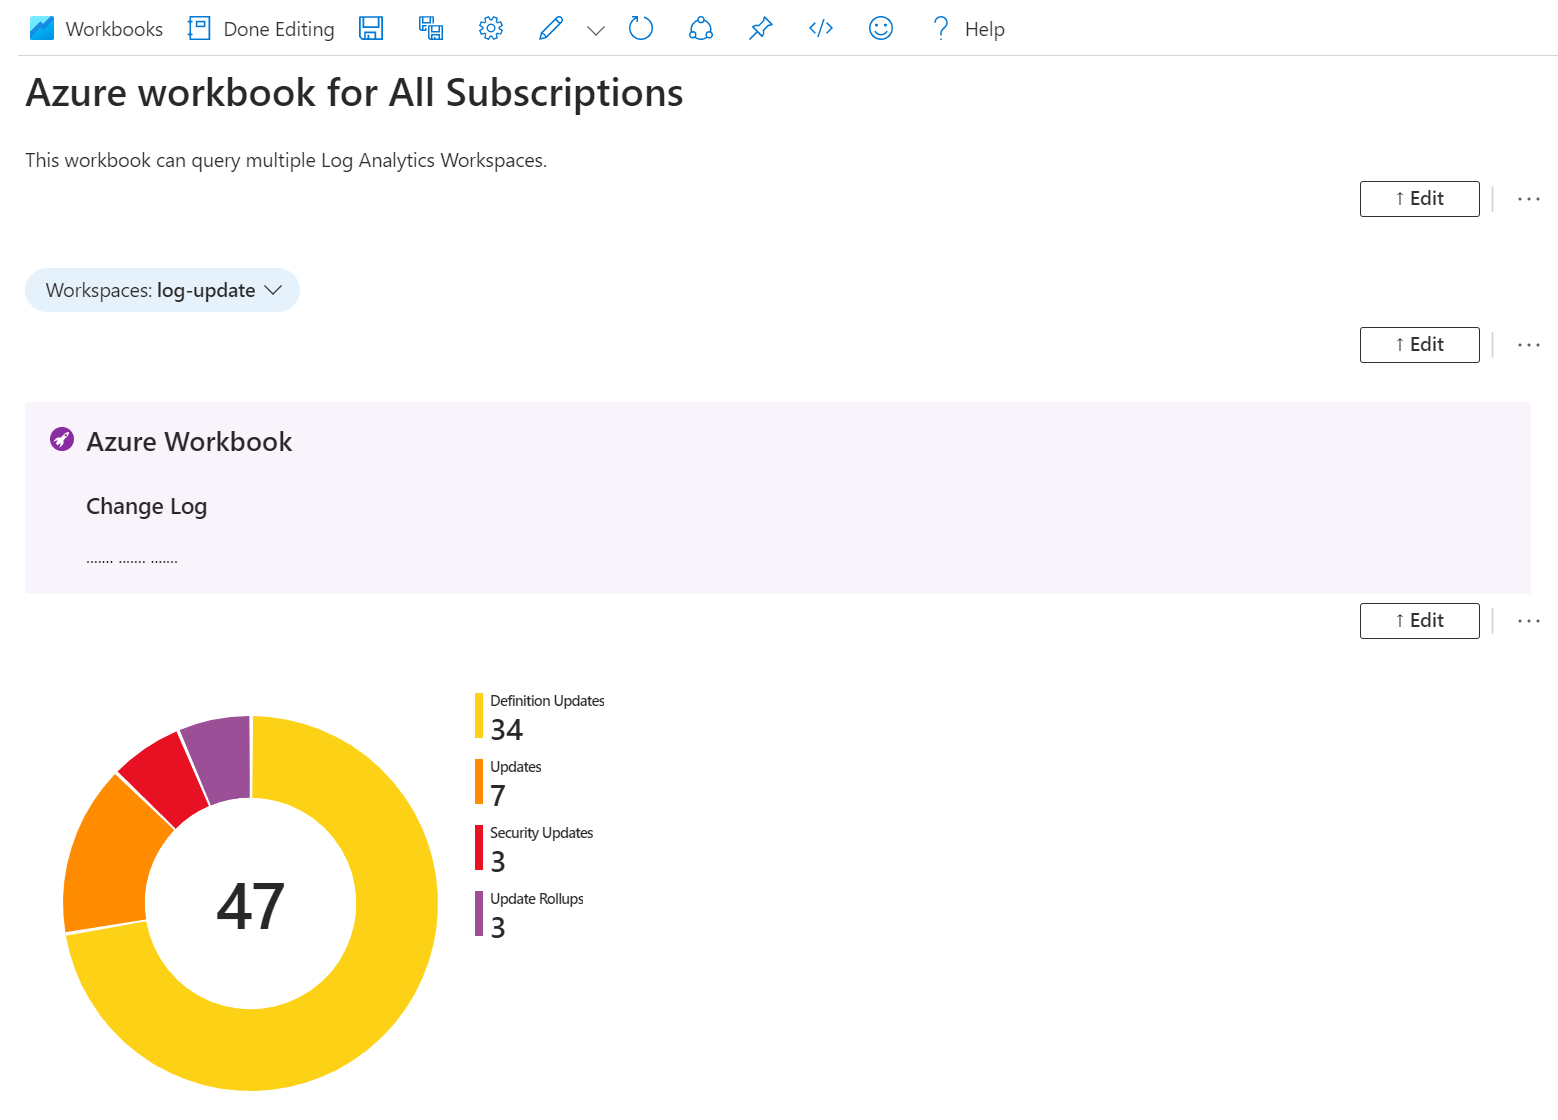
The query is based on the Azure Update Management service to visualize the Windows Updates status.
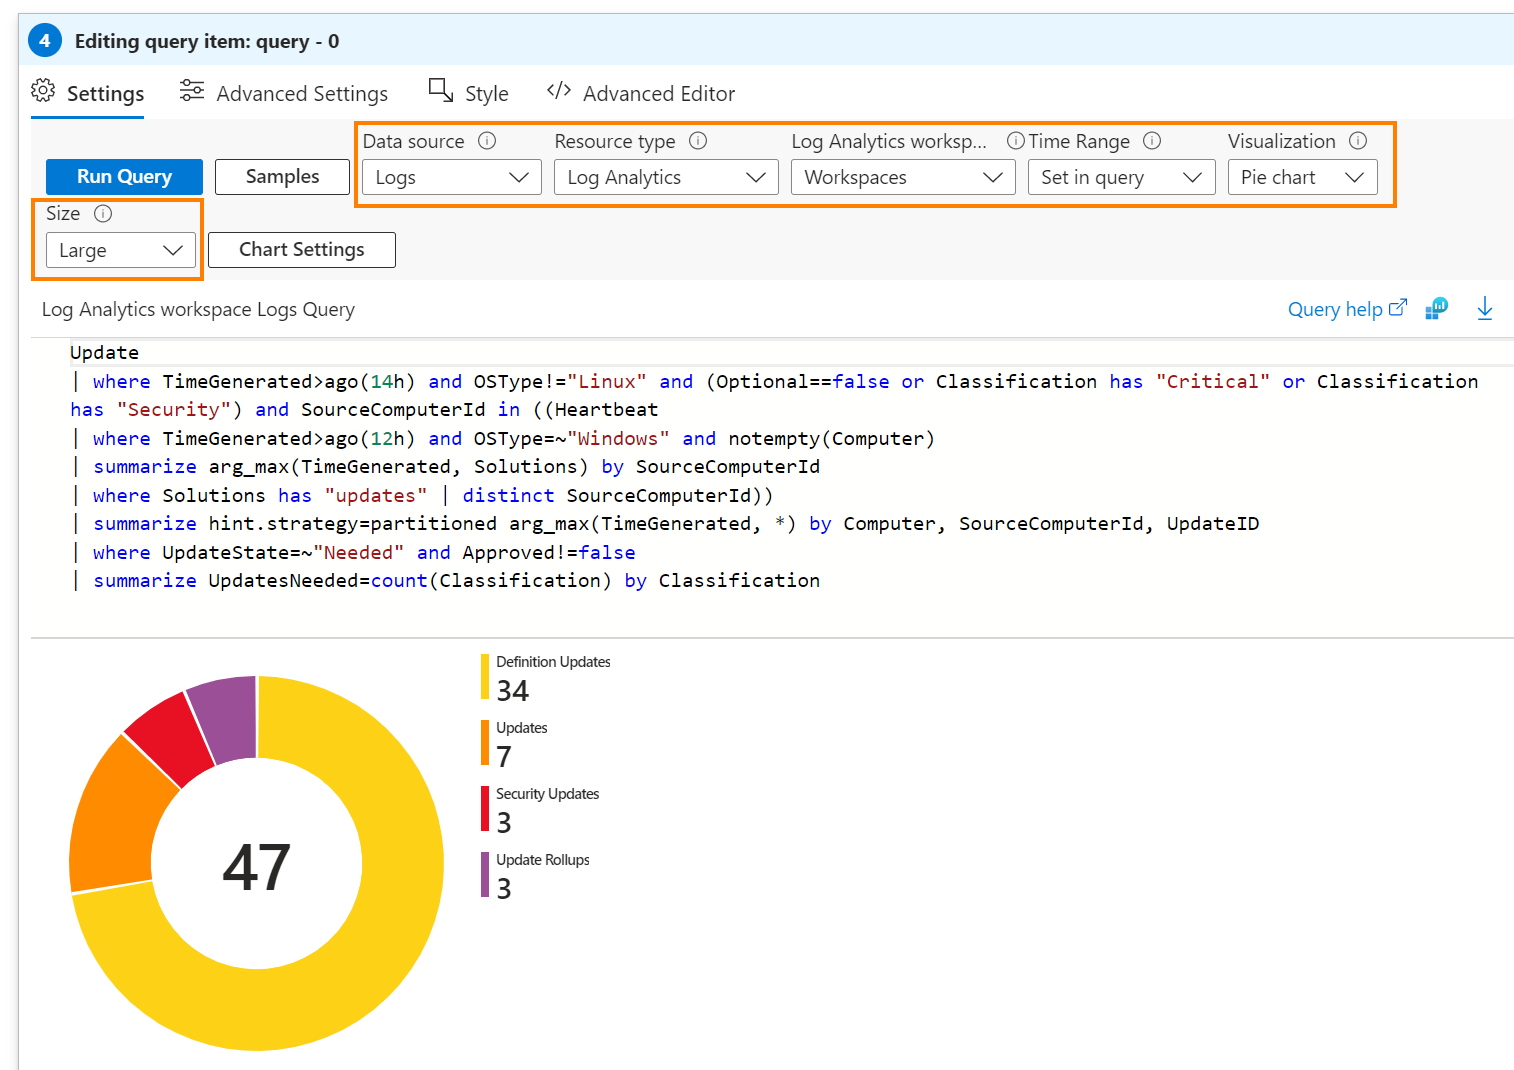
Save the query and confirm the result.
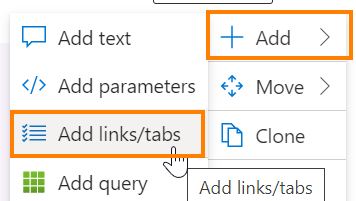
You may need a way to segment information in different sections in your Azure workbooks. We can build tabs very simply using the following option:
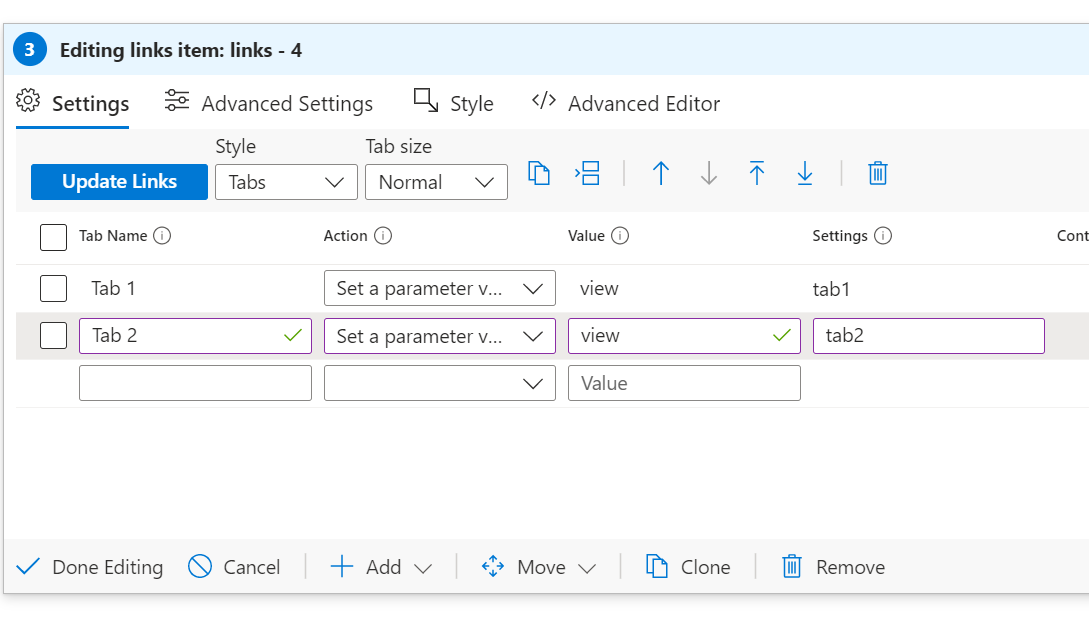
Add two tabs :
- Tab name = Tab1 and Tab2 (this name will be visible in your workbook)
- Action = Set a parameter value
- Value = view (but you can enter whatever you want)
- Settings = tab1 and tab2 (but you can enter whatever you want)
You should see two tabs appear
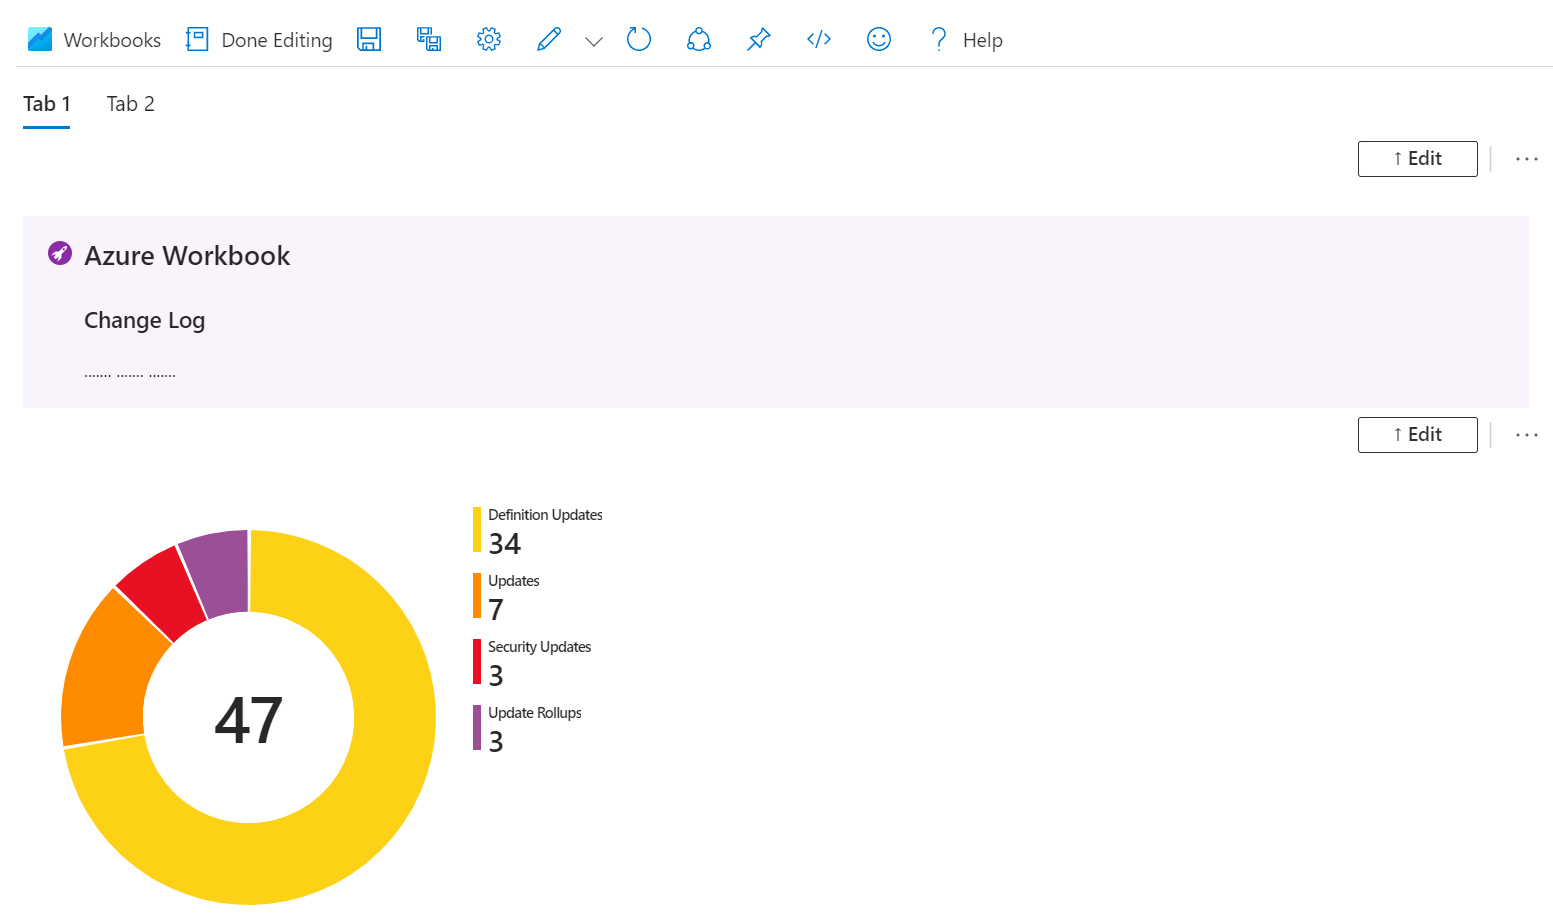
Then, we need to organize resources in both tabs. Edit a text section created earlier and go to Advanced Settings, click Make this item conditionally visible.
- Parameter name must be equal to the name you entered earlier (view)
- Comparison must be “equals”
- Parameter value must be the name you entered earlier (tab1)
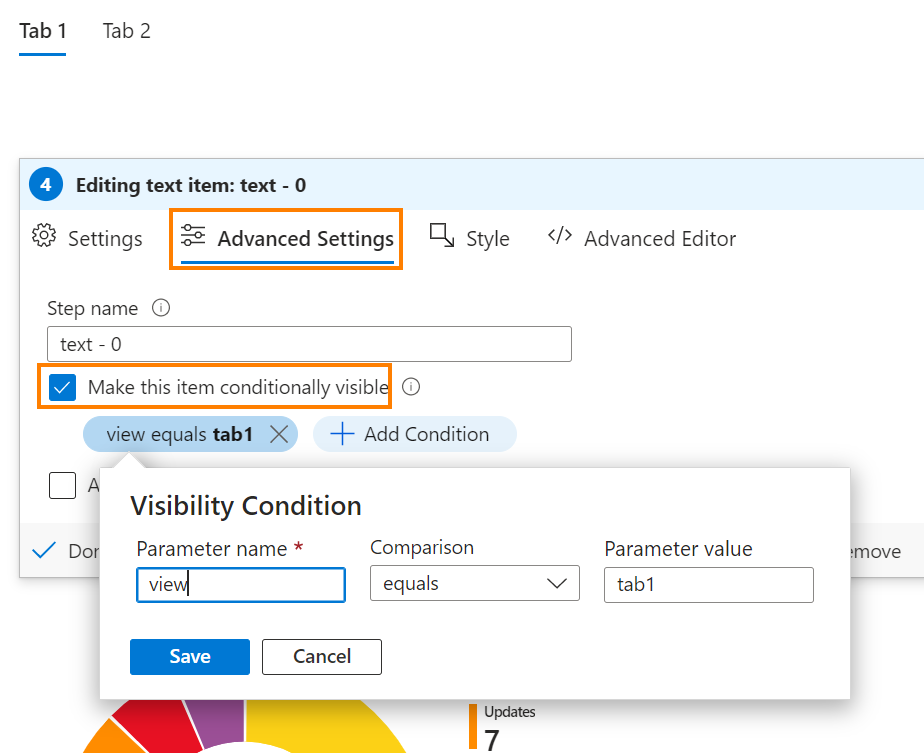
Save this section, and repeat the same step for the query section
Go to Advanced Settings, click Make this item conditionally visible.
- Parameter name must be equal to the name you entered earlier (view)
- Comparison must be “equals”
- Parameter value must be the name you entered earlier (tab2)
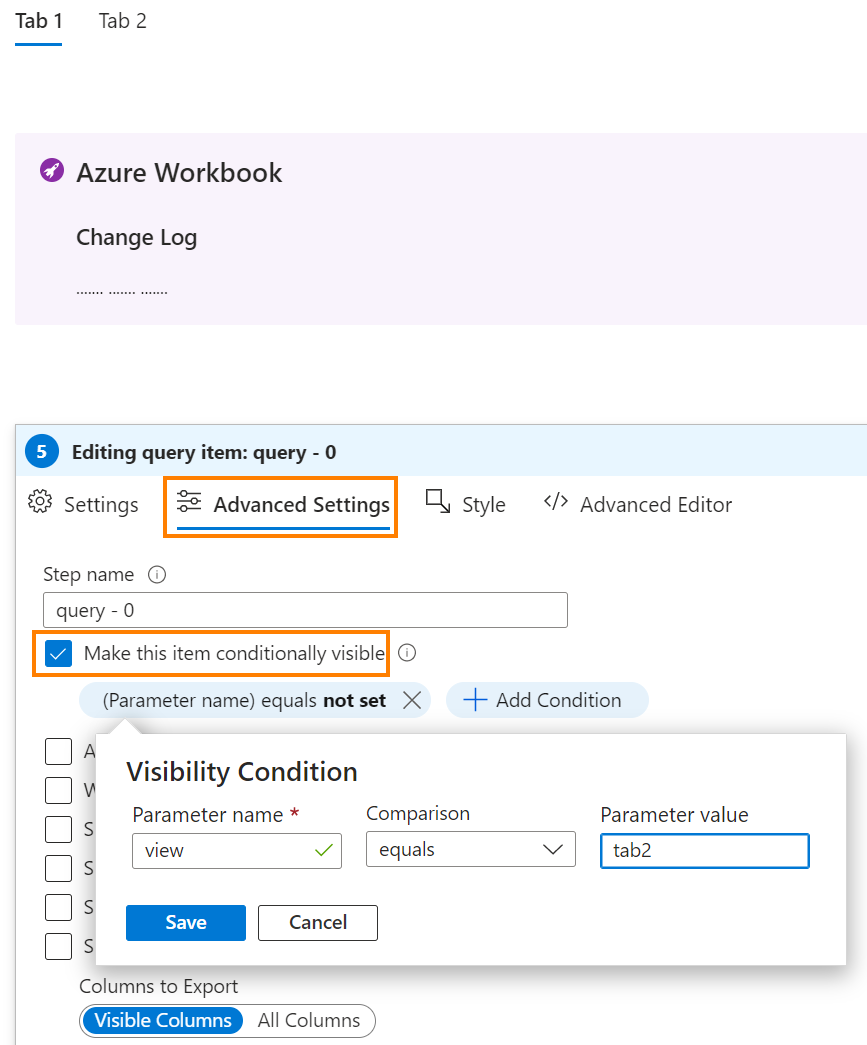
Save the section and confirm the results. When you click on Tab1 or Tab2, you should see:
- Tab1 with the text section
- Tab2 with the query section
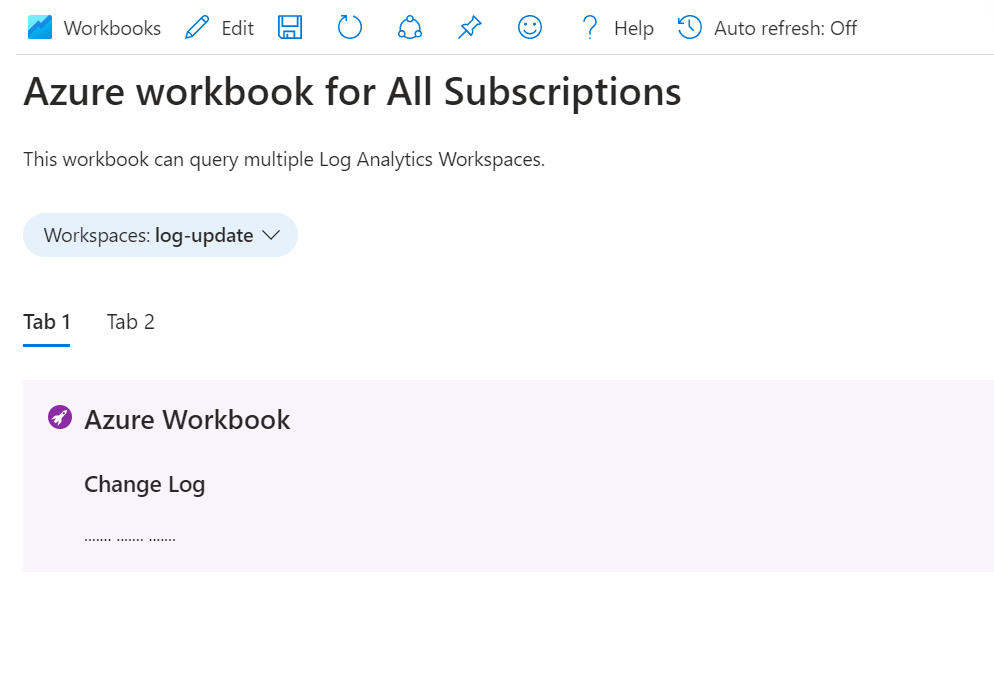
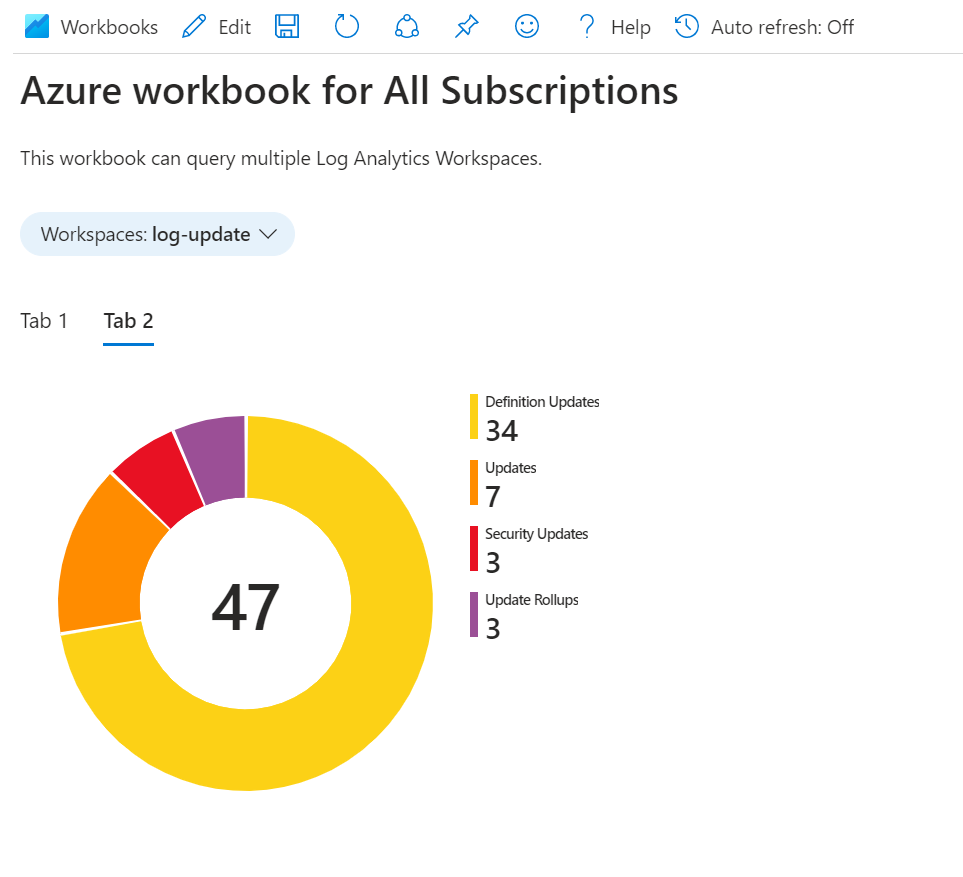
To finish, please note that when you save your Azure workbooks, they are stored as an Azure resource in your Azure tenant.
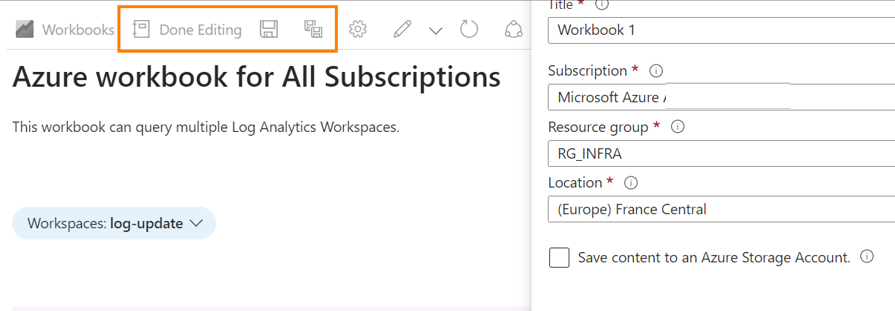
Go to Azure Workbook section
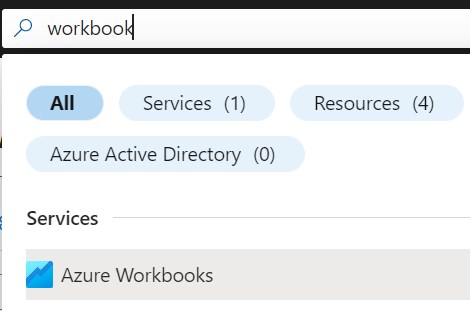
You should find your Azure workbook, then you can share access with someone else.

All you need to know about Azure Workbook, please read the official documentation: https://learn.microsoft.com/en-us/azure/azure-monitor/visualize/workbooks-overview.
Related materials:
- Sending an Email from Azure using Microsoft Graph API
- Exclude users with VPN or Remote Desktop Gateway access from NPS Extension for Azure MFA
from StarWind Blog https://bit.ly/3NrHKij
via IFTTT
No comments:
Post a Comment