HashiCorp recently proposed a new method to consume Vault secrets — the Vault Secrets Operator. By implementing a Kubernetes Operator, you can now synchronize your secrets from different Vault secrets engines like Key/Value, Database, or PKI to a Kubernetes secrets store. As a result, without any code application changes, you can now sync Vault secrets to Kubernetes Secrets.
As teams adopt the Vault Secrets Operator for Kubernetes, it becomes a critical component of their platforms and must be monitored closely. This post will walk you through how to use the Prometheus Operator and the Prometheus metrics endpoint provided in the Vault Secrets Operator. This allows users to be alerted to any potential issues with the system. You’ll also see how to integrate Prometheus output into a Grafana dashboard.
Demo project architecture
In this walkthrough, the Vault Secrets Operator starts out deployed in a dedicated namespace called vault-secrets-operator with Helm. This is in line with our Installing the Vault Secrets Operator documentation. The Prometheus Operator will be used with kube-prometheus to simplify integration. At the end of installation, your setup should look like this:
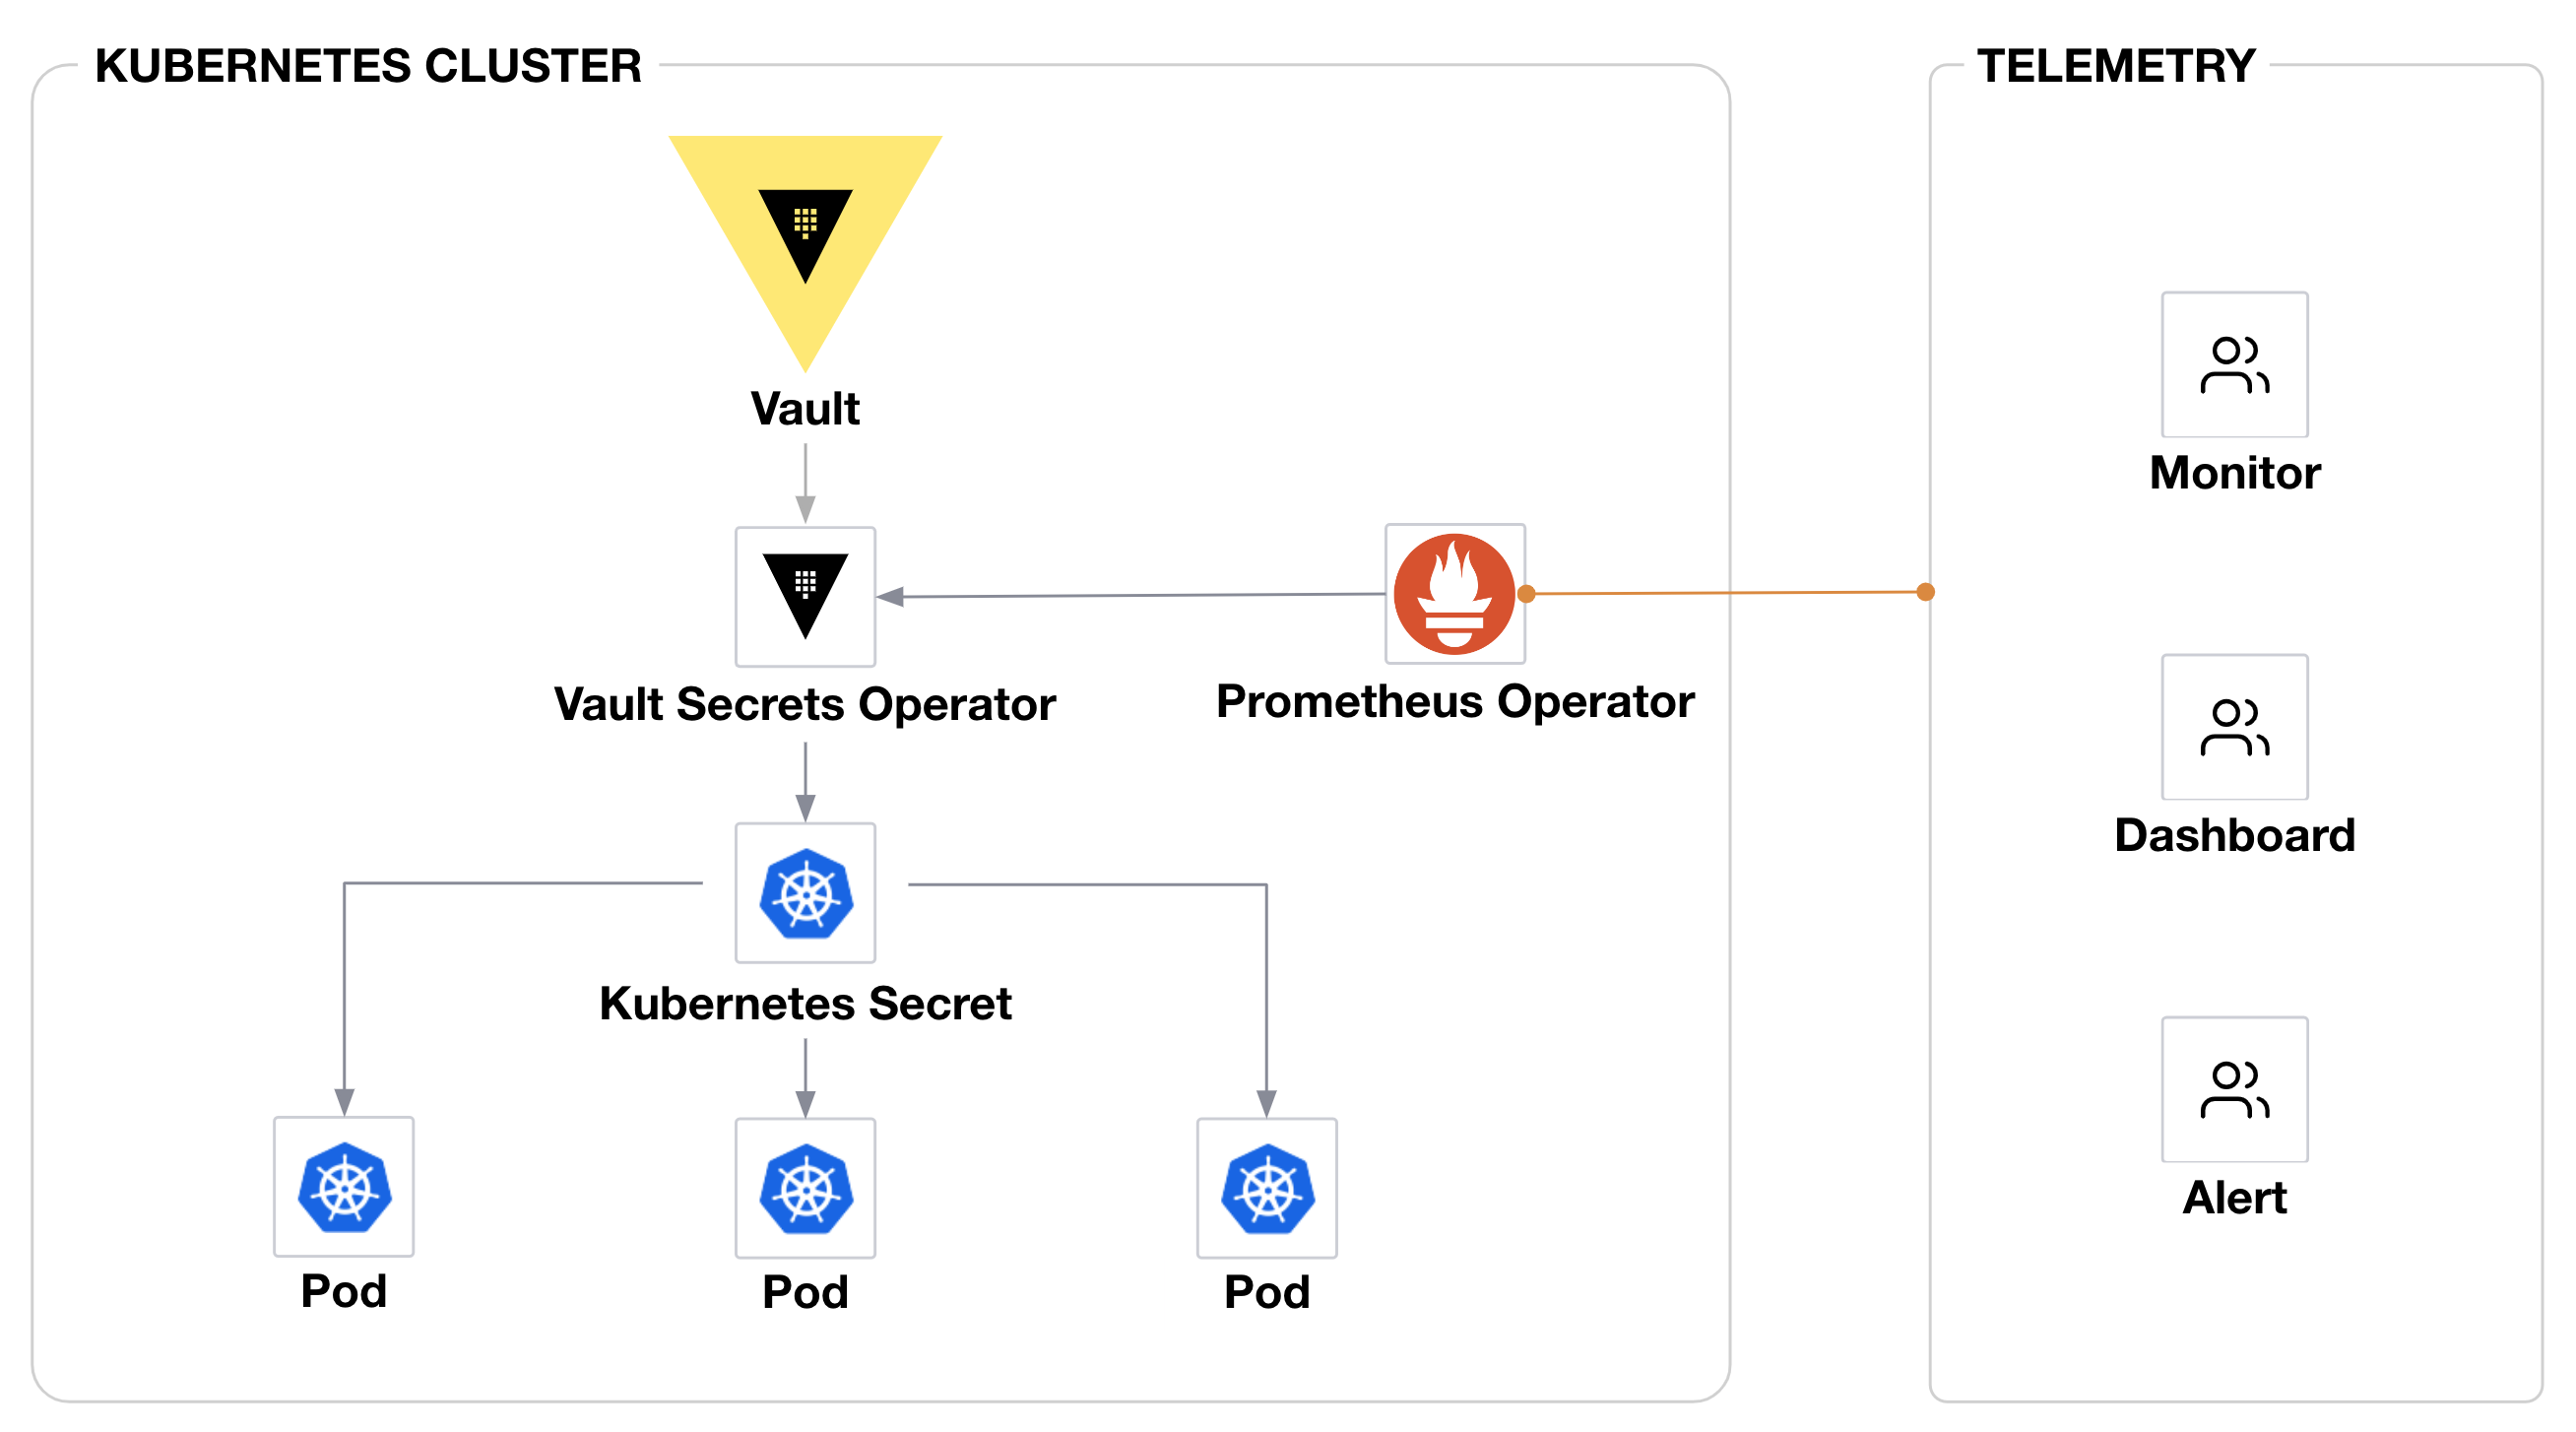
The Vault Secrets Operator is in charge of syncing secrets from HashiCorp Vault to Kubernetes Secrets and exposes metrics through the Prometheus endpoint. Those metrics are then scraped by the Prometheus Operator, which provides alerts and is used as a datasource for the Grafana dashboard.
Deploy Prometheus Operator
The Vault Secrets Operator was built using Kubebuilder (an SDK to build Kubernetes APIs), which exposes a set of protected metrics by default. As mentioned in the Vault Secrets Operator announcement, there are a number of metrics available through an endpoint supported by Prometheus Operator.
The first step in the deployment process is to deploy kube-prometheus: a packaged method for deploying Prometheus and monitoring-related solutions like alertmanager for alerting and Grafana for dashboards.
Install kube-prometheus using Helm:
# Add helm repository
helm repo add prometheus-community https://prometheus-community.github.io/helm-charts
helm repo update

# deploy from helm repository
helm install kube-prometheus prometheus-community/kube-prometheus-stack -n observability --create-namespace
The code above deploys your Prometheus server with alertmanager and Grafana.
Next, forward port 9090 for a Prometheus service:
kubectl port-forward svc/kube-prometheus-kube-prome-prometheus 9090:9090 -n observability &You should get access to the Prometheus UI, but note that the Vault Secrets Operator does not yet appear as a target for Prometheus scraping.
Create the ServiceMonitor
Without kube-prometheus, you would need to grant permissions to your Prometheus server so it can scrape the protected metrics. That process would involve creating a ClusterRoleBinding to bind the ClusterRole to the service account that your Prometheus server uses. But because we’re using kube-prometheus, this binding is already deployed.
When deploying the kube-prometheus from the Helm chart, several custom objects are already created in the Kubernetes cluster. One of them is the prometheus object, which defines all configurations used by Prometheus (such as scraping endpoints, scraping interval, etc.). Here is the default config that gets deployed:
kubectl get prometheus -n observability

NAME           VERSION   DESIRED   READY   RECONCILED   AVAILABLE    AGE
kube-prome...  v2.42.0   1         1       True         True         18m
You can see that an object called kube-prometheus-kube-prome-prometheus was created, and it contains all the configurations.
The Prometheus Operator offers multiple ways to define resources to be monitored. For the purposes of this blog post, we will use the serviceMonitorSelector:
kubectl get prometheus -n observability kube-prometheus-kube-prome-prometheus  -o=jsonpath='{.spec.serviceMonitorSelector}'

{"matchLabels":{"release":"kube-prometheus"}}
Looking deeper, you can see that Prometheus is considering all ServiceMonitor instances with the label: release:kube-prometheus (by using the serviceMonitorSelector).
So, you will next create a ServiceMonitor object for the Vault Secrets Operator. HashiCorp has a sample ServiceMonitor that you can use to start building your configuration, adding the label name: controller-manager-metrics-monitor:
cat from HashiCorp Blog https://bit.ly/3oMVZo0
via IFTTT
No comments:
Post a Comment