Whether an ethical hacker or SOC analyst, you must understand how to use Wireshark to capture network traffic. This powerful open-source network protocol analyzer can turn bytes on the wire into readable packets you can analyze.
Wireshark can troubleshoot networks, extract sensitive information from network packets, and identify cyber attacks. This comprehensive guide will show you how to use this powerful tool, when it should be used, and how to capture and analyze network traffic. You will also see how to use Wireshark in the real world to perform common red and blue team activities.
Let’s get our keyboards ready and start capturing network traffic with Wireshark!
What Is Wireshark?
Wireshark is an open-source network protocol analyzer widely used to troubleshoot network issues, analyze network packets, and perform security auditing. However, its true power comes from its unmatched support for over 3000 network protocols. This lets the tool transform bytes on a network into visual network packets that you can efficiently analyze using its graphical interface and various features.
Wireshark features:
- Packet capture: Wireshark can capture traffic using your network interface.
- Protocol analysis: Wireshark supports the decoding and analyzing of over 3000 network protocols so you can understand their structure and content.
- Packet filtering: Wireshark includes powerful display and capture filters that filter network traffic.
- Network packet reconstruction: Wireshark can reconstruct network packets to display application-level protocols so you can see web pages, images, or other application data.
- Network traffic statistics and visualizations: Wireshark provides statistical data and visualizations of network traffic.
- Customization: You add functionality or customization to Wireshark through its plugins.
Analyzing network traffic is crucial in cyber security. It allows you to perform blue team activities (such as detecting a cyber attack, analyzing malware, and collecting forensic evidence) and red team tasks (like stealing sensitive information, extracting files, and testing your malware’s network communications).
Wireshark lets you do all these things and more! Let’s find out how.
Wireshark can be used for packet capture or as a packet sniffer. Packet capture is when you record the network packets traveling across the network to and from your machine. It is commonly used to troubleshoot network problems or perform blue team activities.
Sniffing involves capturing network packets traveling across the network that are not intended for your machine. You can set your capture interface to promiscuous mode and use Wireshark to perform sniffing. To learn more about sniffing, read What Is Arp Spoofing and How Does It Work? A Novice’s Guide.
When Should Wireshark Be Used?
Wireshark should be used whenever you need to analyze network packets and understand the network communication happening across a network.
However, its most powerful feature is its ability to perform network protocol analysis. The tool supports many network protocols and can transform network packets into human-readable data. Using Wireshark's built-in features, you can perform statistical analysis on this data, follow TCP streams, read sensitive information, extract full files, and much more.
Capturing Network Traffic
To use Wireshark, you can capture network traffic or upload a packet capture (pcap) file. Let’s look at how to capture network traffic.
Wireharsk comes pre-installed on Kali Linux, so to capture network traffic in Wireshark, you only need to perform three steps:
Step 1: Open the Wireshark application
First, open the Wireshark application by clicking on the icon. Wireshark’s welcome screen will greet you.

Step 2: Select a network interface to capture traffic on
From the welcome screen, select which of your network interfaces you want to capture traffic on. The line to the right of the interface indicates the network traffic flow passing through that interface.

Step 3: Stopping the packet capture
Double-clicking on the capture interface you want to capture traffic to start capturing packets.

To stop capture packets, click on the red Stop Capture button.

This will save the packet capture into a temporary file and allow you to perform your analysis.
To save your data into a specific file. Select File > Save As, then enter the location and name of the file under which you want to save this data.


To start a new packet capture, select the Start Capture button. Any unsaved capture data will be automatically deleted.

When capturing network traffic with Wireshark, you can use the tool’s capture filters to limit the network packets that should be captured by the tool using specific criteria a packet must meet. They help you narrow the scope of the network traffic captured to only what is relevant to you and reduce Wireshark’s processing overhead.
However, you usually want to capture all the network traffic on an interface and use Wireshark’s display filters to filter a saved packet capture. This means you won’t miss any relevant network traffic that the capture filter may have excluded.
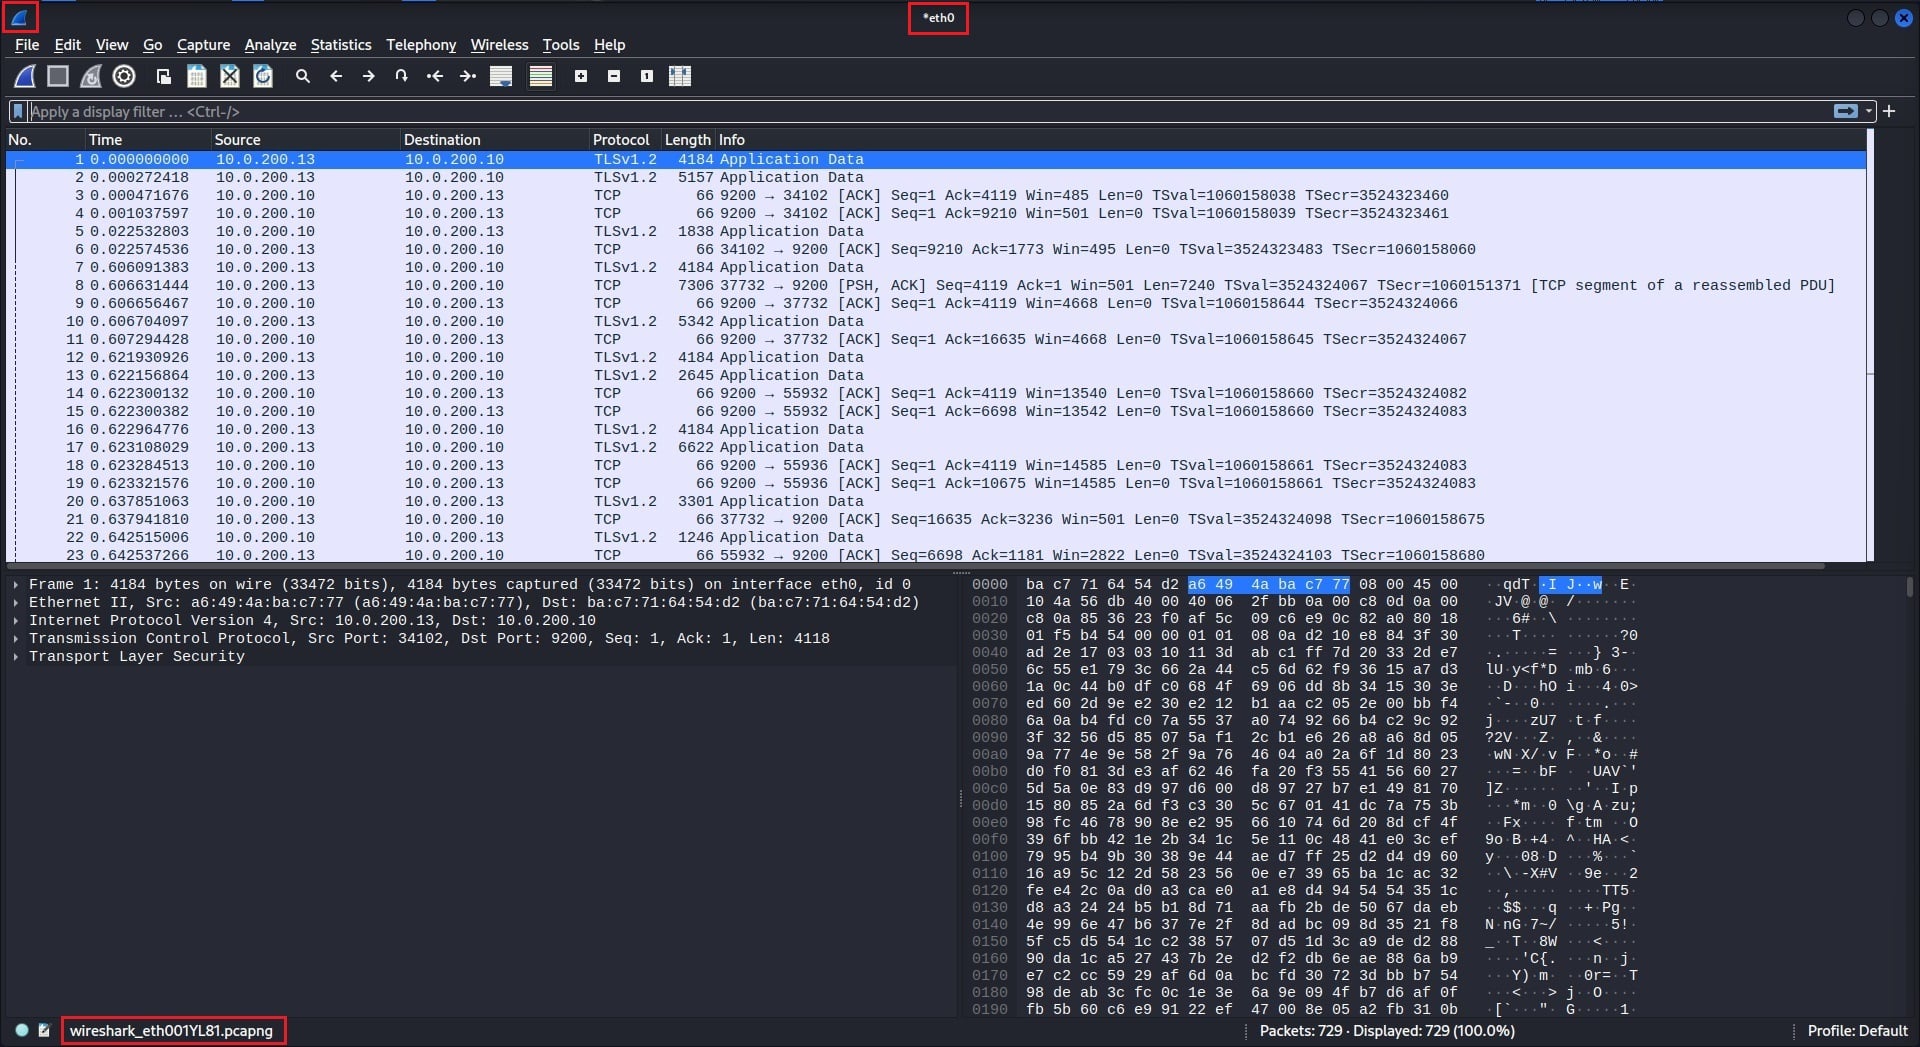
Understanding the Interface
Once you have captured network traffic or imported a saved packet capture file, you will be greeted by Wireshark’s default interface. This interface is compromised of four components.
The menu bar
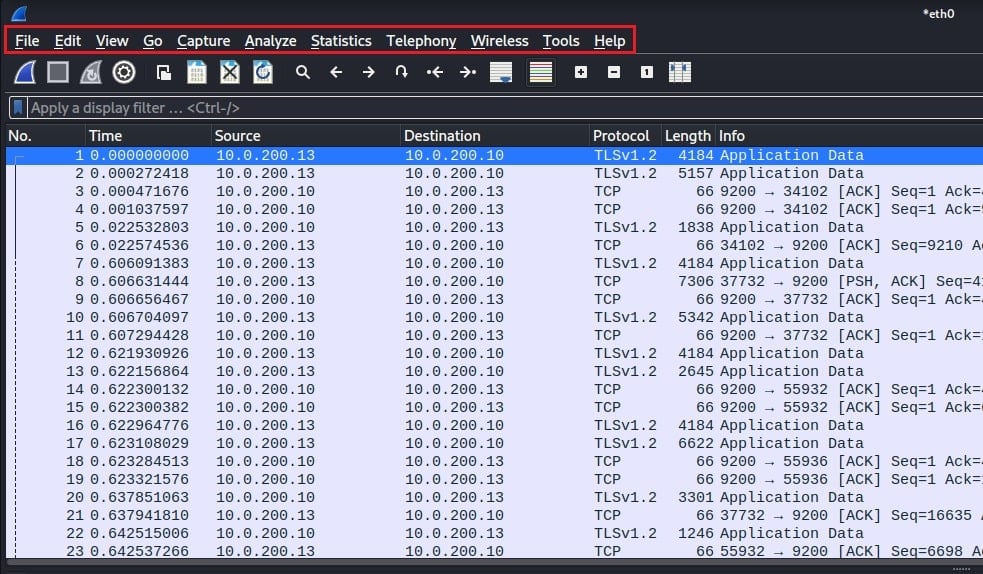
Wireshark’s menu bar is located at the top of its interface. It consists of several menus you can use to take advantage of Wireshark’s powerful features:
- File: To can open and save files, as well as export packets, TLS session keys, and objects.
- Edit: To modify captured packets.
- View: To customize Wireshark’s interface.
- Go: For packet navigation.
- Capture: To control starting, stopping, and configuring packet captures.
- Analyze: Wireshark’s tools for analyzing network packets.
- Statistics: For applying statistical analysis to network traffic.
- Telephony: For analyzing Voice over IP (VoIP) traffic.
- Wireless: For analyzing Bluetooth traffic.
- Tools: Additional custom tools written in Lua.
- Help: Links to Wireshark’s documentation.
The main toolbar
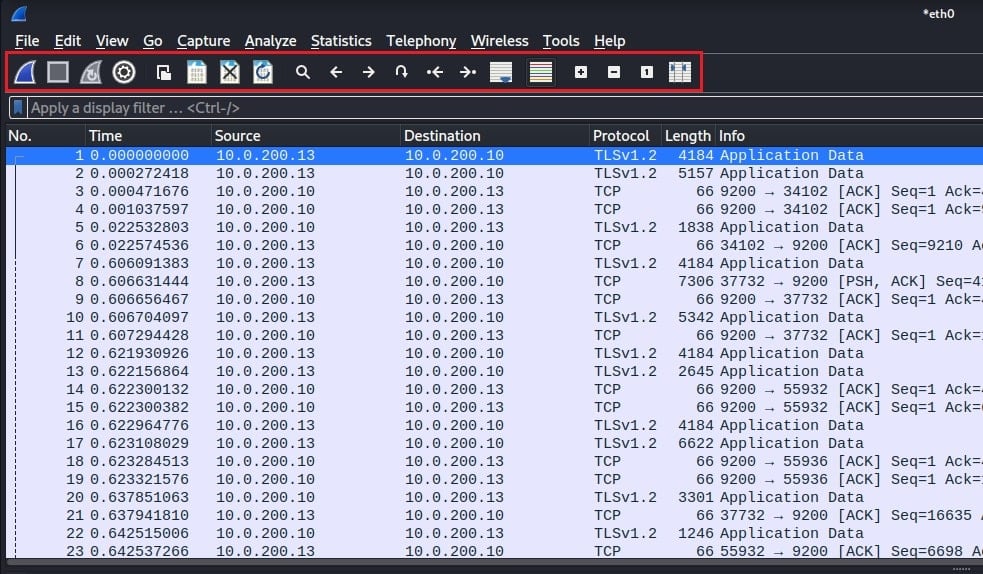
Below the menu bar is Wireshark’s main toolbar. These shortcut buttons let you start/stop your packet capture, adjust your capture options, open/close capture files, search for packets, and resize interface panes.
The display filter bar
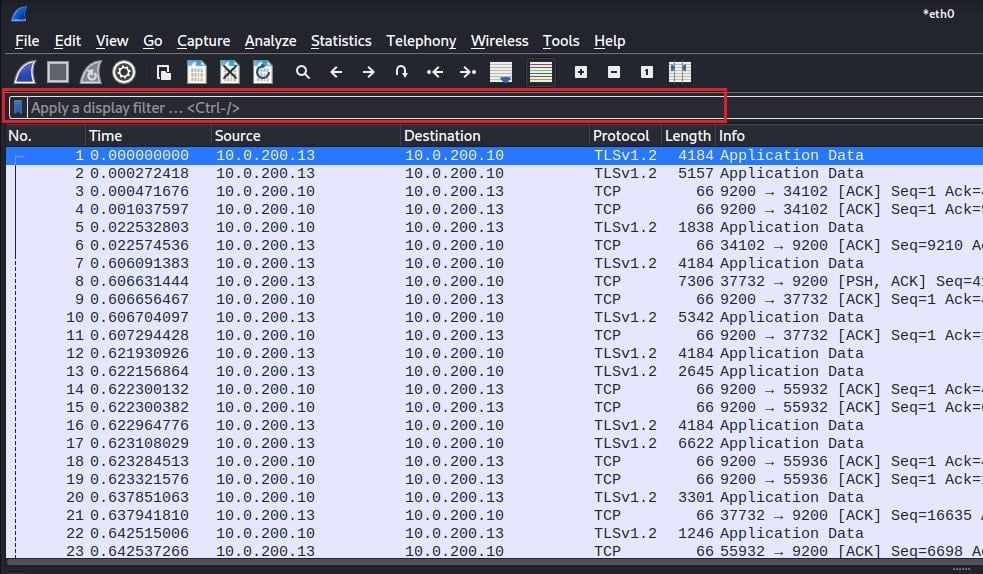
Next down is Wireshark’s display filter bar. This allows you to filter the network traffic you have captured based on protocol, source/destination IP address, port number, MAC address, packet type (e.g., ICMP, ARP, etc.), packet length, time range, and packet content. You will see this in action later.
The packet list pane
This is the main area of Wireshark’s interface. It summarizes the key details of each packet captured, which you can scroll through or sort using the various columns. You can also right-click on an individual packet to perform various actions, such as marking a packet, applying filters, or following a packet stream.
The packet details pane
Once you select a packet, the packet detail pane will populate. This includes the specific network packet details broken down based on TCP/IP network layer. You will see how to inspect individual packets later.
The packet bytes pane

To the right of the packet details pane is the packet bytes pane. This shows the corresponding bytes Wireshark extracted from the wire to reconstruct the network packet data. These bytes are shown in hexadecimal format and are highlighted when you select information within the packet details pane. This pane is often used for troubleshooting when Wireshark cannot parse network data.
Analyzing Captured Traffic
You can take several actions in Wireshark to analyze the network traffic you have captured. The first of these is examining the individual packets captured.
Examining Packets
To examine a packet, select it within the packet list pane. This will populate the packet details pane with that packet's network information.

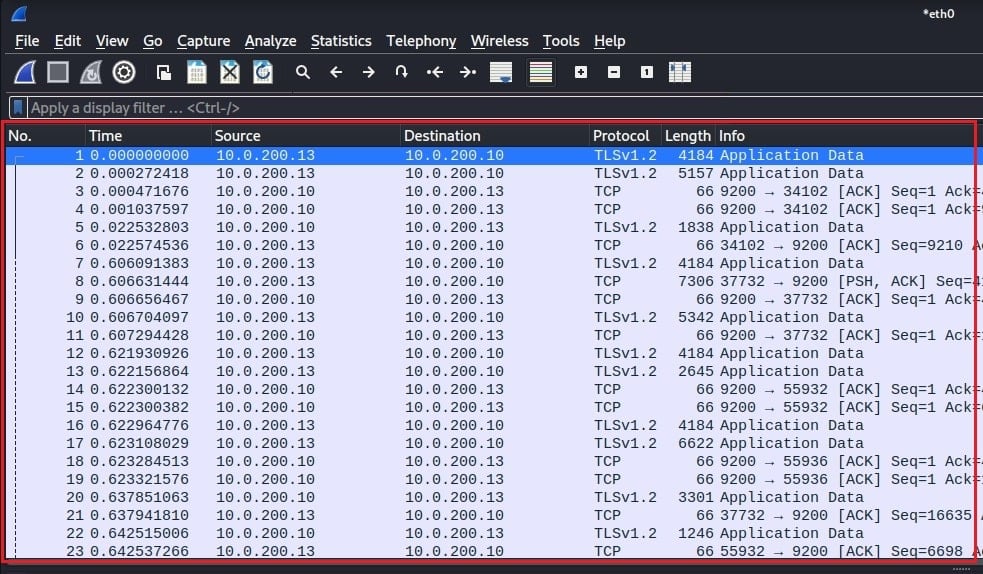
Here packet number 11 has been selected. You see a right-facing arrow indicating a request in Wireshark’s packet list pane and a left-facing arrow indicating a response several packets down (packet 14). This is a classic HTTP request and response network conversation.
You will also see the packet details pane populated with network information about packet number 11, including information at the link, Internet, transport, and TCP/IP stack application layer.
To start, you can analyze the network information at the link layer. This includes the source and destination MAC addresses of the two communicating devices and the type of Internet protocol used (IPv4 or IPv6).

You can then move on to the information included within the Internet layer. This example contains information specific to the IPv4 protocol, such as IP flags, the source and destination IP address, Time to Live (TTL), the transport protocol encapsulated within this packet (e.g., TCP), and other header information.

Following the IP layer is the transport layer. This network protocol is responsible for the end-to-end data delivery between hosts and will be either UDP or TCP. It includes the source and destination port of the segment, TCP-specific header flags, the size of the encapsulated application message, and other header information.

Finally, the packet details pane will show you network information about the packet's application protocol (if an application protocol is used). In this case, HTTP is the application protocol, so you can see information about the request method, request URI, and other common HTTP headers. This will be where you find most of the network information you want to analyze.

Refining your view with display filters
You must sift through thousands of network packets when analyzing traffic. To make this task more efficient, Wireshark has built-in display filters that you can use to narrow down the packets displayed in its packet list pane.
To use these filters, enter them into Wireshark’s display filter bar (below the main toolbar).

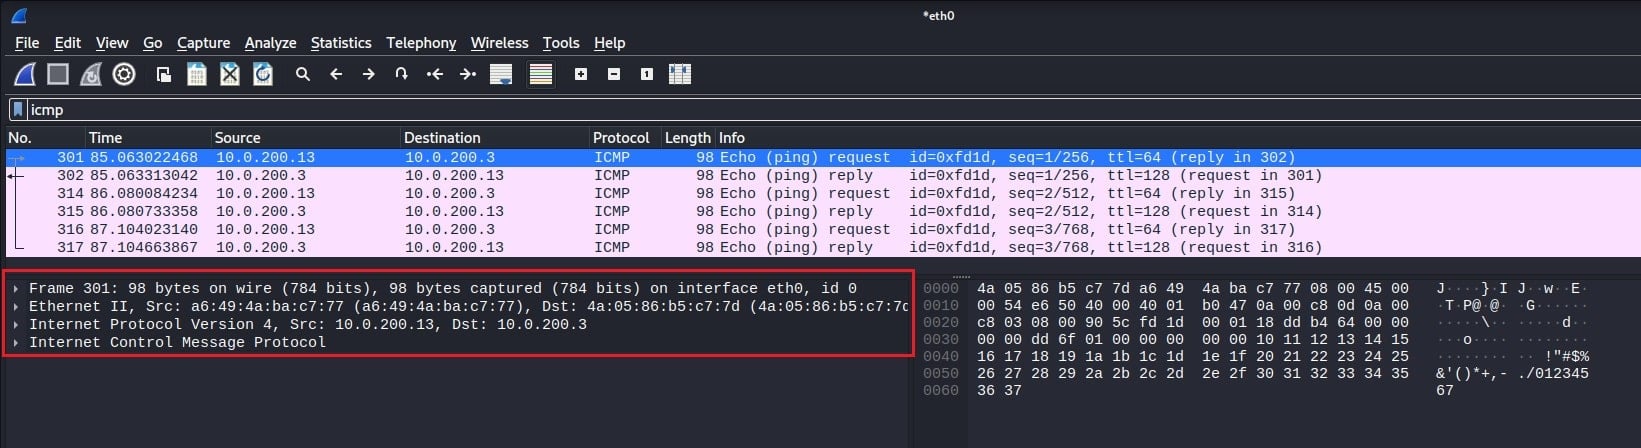
In this screenshot, the filter icmp has been used. This filter will only display packets that use the Internet Control Message Protocol (ICMP) as their network-layer protocol. Now you can analyze all relevant packets without searching through thousands of irrelevant ones. Wireshark will show you how many packets have been filtered out by your display filter at the bottom right of its interface.

You should use display filters to refine your view and speed up your network analysis. To learn more about Wireshark’s display filter syntax, look at Wireshark Cheat Sheet: All the Commands, Filters & Syntax. This will show you how to filter by IP address, port number, protocol, and more!
Performing statistical analysis
Aside from analyzing individual network packets, Wireshark also has a powerful statistical analysis feature that lets you quickly summarise your network traffic.
Select the Statistic menu from Wireshark’s main menu bar. This will provide options for showing summary information about the protocols being used, the endpoints communicating, and the network conversations between those endpoints.

Select the Protocol Hierarchy option to discover the protocols used within your captured network traffic. This will generate a window summarizing the network protocols used at each TCP/IP stack layer.

Select the Endpoints option to find out what endpoints are present in your network traffic. This will list all the unique endpoint devices communicating within the network packets you have captured based on Ethernet address, IP address, and TCP/UDP port.
In the example below, the IPv4 tab has been selected. This shows that four devices are communicating in this packet capture, with two being the primary exchangers of data.

Select the Conversations option to delve into the network conversations within your packet capture. This will show you the network traffic traveling between endpoints. Here you can see a lot of data is traveling between 10.0.200.13 and 10.0.200.10, while very little is between 10.0.200.13 and 10.0.200.11.

You can use Wireshark’s statistical analysis feature to quickly identify outliers within your packet capture and refine your search using display filters to analyze these outliers.
Techniques
Now that you have a basic understanding of capturing and analyzing traffic with Wireshark let’s look at how you can use this powerful network protocol analyzer in the real world. The following are three use cases you will likely encounter whether you are on the red or blue team in cyber security.
Following TCP Streams
One of the most common use cases for Wireshark is following TCP streams. By following this stream, you can see the conversation between the two devices and the data they exchanged. This is useful for troubleshooting network issues or discovering hidden information.
To follow a TCP stream in Wireshark, right-click on a packet whose TCP stream you want to follow.

Here packet number 5 has been selected. It is a TCP connect request (TCP SYN flag) sent to port 8000 on machine 10.0.200.20 and is the start of the TCP three-way handshake. A drop-down arrow on the left of the packet list pane indicates the entire network conversation down to packet number 17. To follow this TCP stream, right-click on packet number 5 and select Follow > TCP Stream.

Wireshark will automatically apply a display filter that only shows packets from this TCP stream.

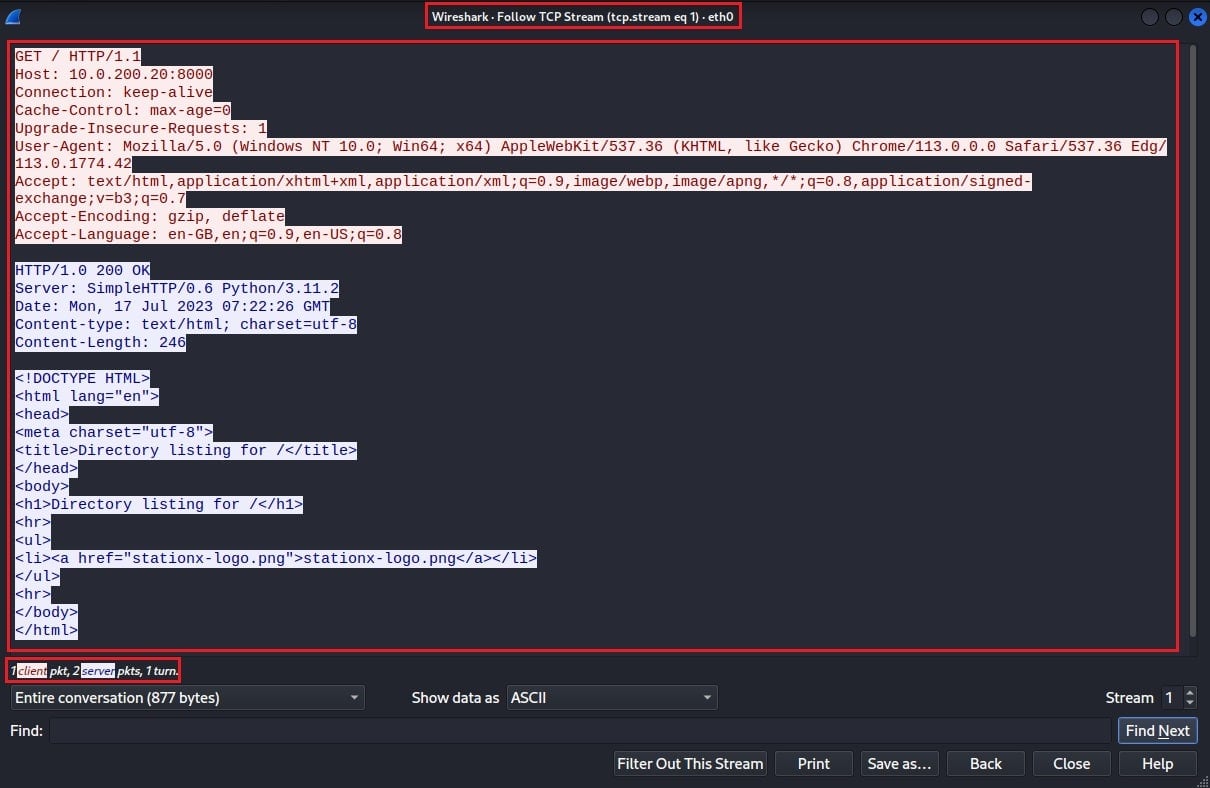
Wireshark will also generate a summary view of the TCP stream in a new window. In this case, it highlights the HTTP messages sent between a client and server.
Extracting Files
If you are on the red team, you often use Wireshark to extract sensitive information, such as usernames, passwords, and files. Wireshark can reconstruct files from the capture packets. This feature is incredibly useful as it allows you to extract various file types from network packets.
To extract files in Wireshark, select File > Export Objects. You can then select the object type you want to export based on the protocol used to transmit said object. In this case, an image was transferred using HTTP.

Selecting HTTP opens a new window populated by all the objects transferred using HTTP in the packet capture file. There are two objects; a static HTML page and a PNG image.
To extract the image, select the packet (41) and click Save.

Now choose a location to save the image file to, and you can open the image in your favorite image viewer.


Using Wireshark, you can extract compressed files, executables, images, videos, email attachments, and other binary file types.
Identifying Attacks
If you are on the blue team, you will likely use Wireshark to identify cyber attacks by analyzing network traffic. This includes brute force attacks, port scans, and data exfiltration. Let’s look at identifying an FTP brute force attack in Wireshark. The following packet capture was performed after running the Hydra online cracking tool against an FTP server.
To see the FTP traffic, you can use the Wireshark display filter ftp.response.code == 530. This is the FTP response code for “Not logged in” and indicates an authentication failure. Seeing several of these errors with the same username but a different password indicates an FTP brute force attack.

To find out if they belong to the same user, change the display filter to ftp.request.command == USER. This will show you all the FTP login requests where a username was specified.

Next, to determine if different passwords are being tried, right-click on a network packet, and select Follow > TCP Stream.

Here the same user tries multiple passwords to log in, indicating a password spray attack against the user stationx-admin.
To determine if any attempts were successful, use the display filter ftp.response.code == 230 to look for “User logged in, proceed.”
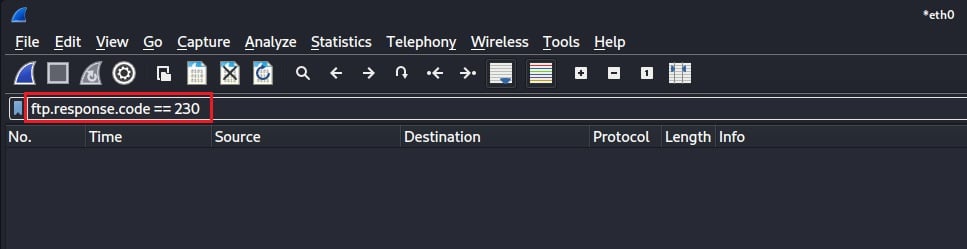
No login attempts were successful!
You can find out what cyber security team you should join in the Red Team vs Blue Team: Which Is the Best Choice for You?
Conclusion
Wireshark is a powerful open-source network protocol analyzer that turns bytes on the wire into network traffic you can analyze. Its simple-to-use interface provides an overview of your capture traffic in the list pane and specific information about each packet in the details pane.
You have seen how to examine network packets in granular detail, refine your view using Wireshark’s display filters, and summarize network traffic with statistical analysis tools. These skills allow you to use Wireshark in the real world for following TCP streams to uncover conversations, extracting files, and identifying cyber attacks
If you want to learn the networking skills required to master Wireshark, try one of these training courses:


Frequently Asked Questions
Wireshark is a network protocol analyzer. You should use this tool whenever you want to analyze network traffic. Common use cases include; network troubleshooting, extracting sensitive information being sent over a network, and identifying cyber attacks.
Yes. Hackers use Wireshark for network analysis or as a packet sniffer. It allows them to capture network packets traveling across a target’s network to collect sensitive information, eavesdrop on communications, and gain insight into potential vulnerabilities they can exploit.
Wireshark has several main uses, these include:
• Network troubleshooting and optimization: Wireshark can be used to diagnose, resolve, and optimize network issues. This includes bottlenecks, bandwidth issues, latency, misconfigurations, and connectivity problems.
• Network security analysis: Wireshark is used by the blue team to detect and investigate malicious activities while also being used by the red team to steal sensitive information.
• Network protocol analysis and development: Developers and network engineers will use Wireshark to test and debug the network protocols they implement in their software.
• Malware and forensic analysis: Wireshark for malware or forensic analysis to gather evidence related to network activities.
• Education: Wireshark is a popular choice for teaching students about networking as it provides practical experience with network traffic analysis and packet capture.
You can learn to use Wireshark to analyze network packets in a few hours. However, mastering Wireshark’s capabilities will take you considerably longer as it is a feature-rich tool capable of performing powerful analysis functions.
No. Wireshark is a network protocol analyzer for analyzing the protocols present in network packets. An IP scanner is a tool used to scan your network for the IP addresses and other relevant network information of devices for tracking rogue devices, performing network troubleshooting, or mapping your IT infrastructure.
Common IP scanners include Angry IP Scanner and Advanced IP Scanner. However, you can also use the popular security tool Nmap as an IP scanner. To find out how Nmap compares to Wireshark, read Nmap vs Wireshark: Comparing The Two Popular Network Tools.
from StationX https://bit.ly/3QIgTQL
via IFTTT
No comments:
Post a Comment