Introduction
It’s challenging to ensure proper protection for your organization in an ever-changing, vulnerable environment. In our survey of over 250 organizations, we found that 80% of security exposures are found in cloud environments and 20% of cloud services change every month. Trying to get a handle on this sort of volatility is not easy, but it is vitally important.
Our 2023 Unit 42 Attack Surface Threat Report explores the global attack surface landscape based on observable data on exposures that are publicly accessible over the internet. It also offers recommendations on how organizations should approach active attack surface management.
Key Findings From the 2023 Unit 42 Attack Surface Threat Report
Constant Change in the Cloud Creates New Risk
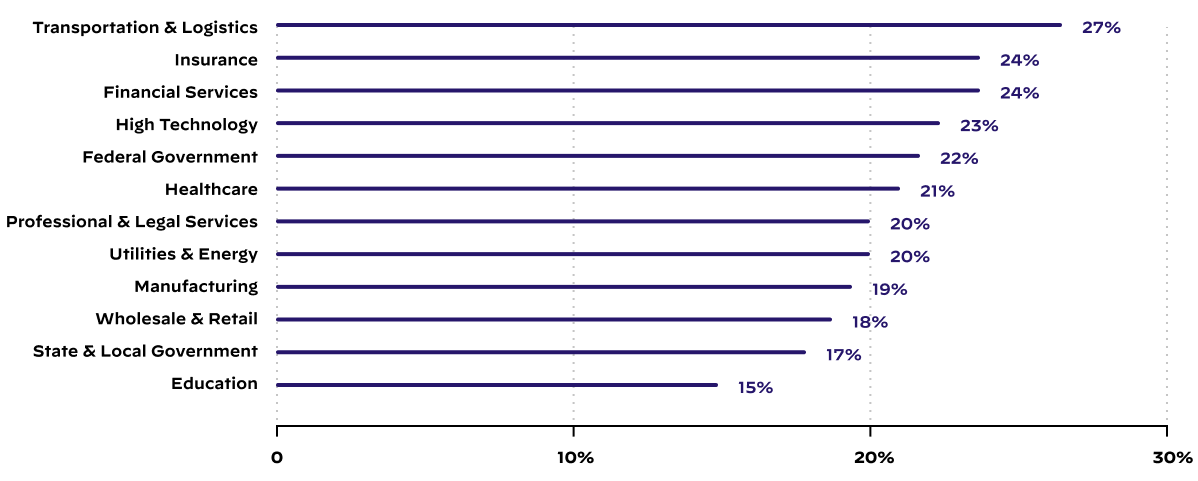
Unit 42 studied the composition of new and existing services running in different cloud providers used by organizations over a period of six months. Cloud-based IT infrastructure is always in a state of flux. On average, over 20% of externally accessible cloud services change monthly across the 250 organizations. Figure 1 shows how this breaks down across different industries.
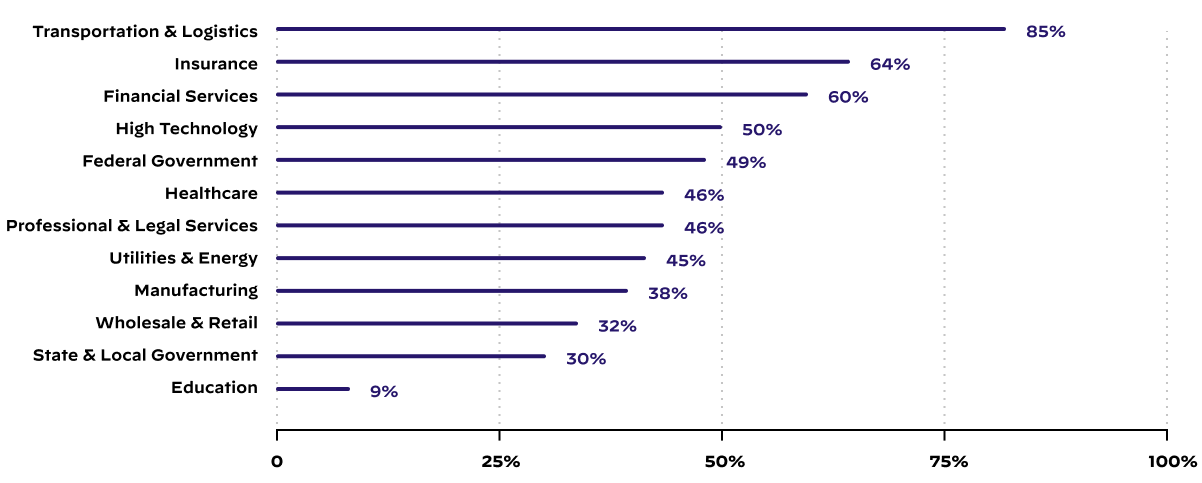
Consequently, Unit 42 investigated the impact on the number of new security risks introduced within an organization, which is illustrated in Figure 2. Over 45% of most organizations’ high-risk, cloud-hosted exposures in a given month were observed on new services that hadn’t been present on their organization's attack surface in the month prior. Thus, the creation of new, publicly accessible cloud services (both intended and unauthorized) is a risk factor related to nearly half of all high-criticality exposures at a given time.
Cloud Exposures Dominate Most Organizations’ Security Risks
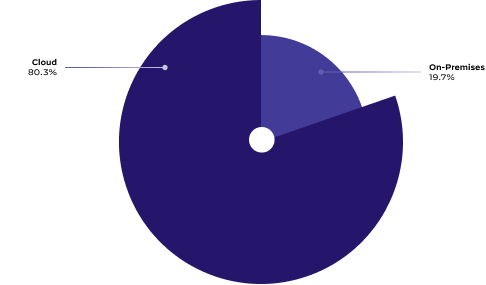
According to our analysis, 80% of security exposures were observed in cloud environments, as shown in Figure 3 below. This higher distribution of exposures in the cloud can be attributed to the following causes:
- Frequent misconfigurations
- Shared responsibilities
- Shadow IT
- Inherent connection to the internet
- Lack of visibility into cloud assets
Three Causes Account for 60% of All Exposure on the Global Attack Surface
Figure 4 shows that across the more than 250 organizations we analyzed, web framework takeover exposures like insecure versions of Apache web servers, insecure versions of PHP and insecure versions of jQuery account for over 22% of the exposures. Poorly configured remote access services like Remote Desktop Protocol (RDP), Secure Shell (SSH), or virtual network computing (VNC) make up 20% of the exposures.
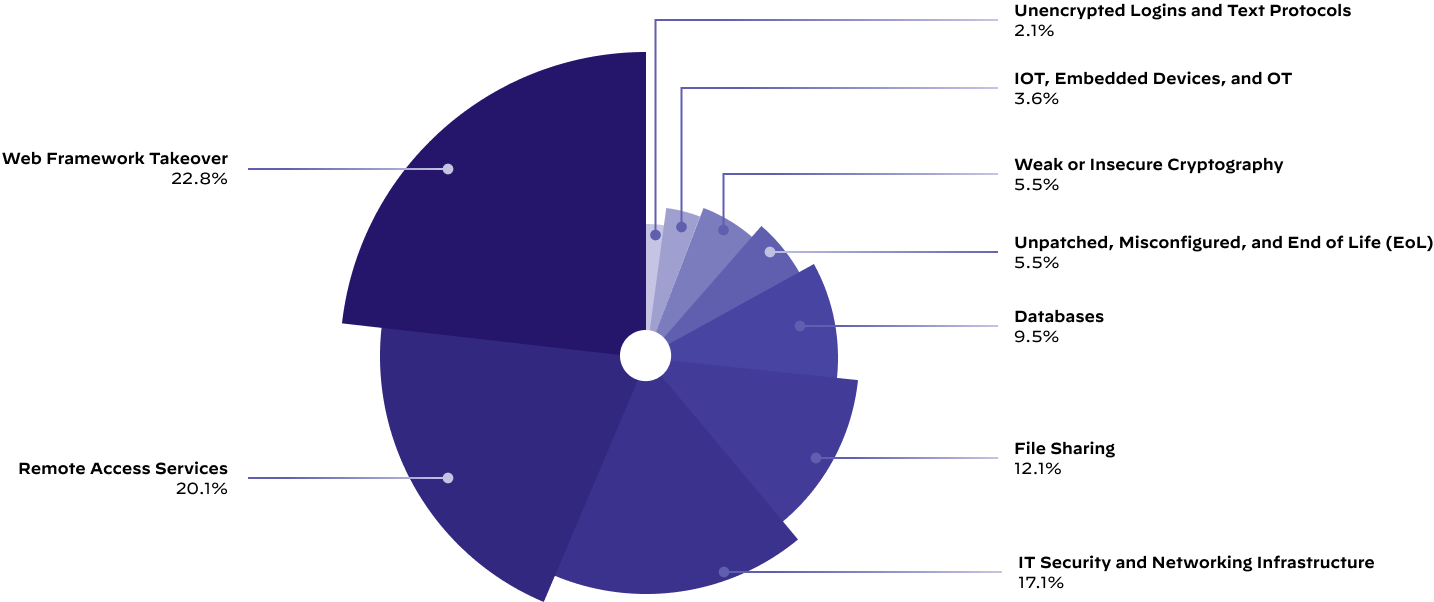
Unit 42 also observed that IT security and networking infrastructure exposures make up nearly 17% of all the exposures of the global attack surface. The exposures in this category consisted of internet-accessible administrative login pages of the following assets:
- Routers
- Firewalls
- Virtual private networks (VPNs)
- Other core networking and security appliances
Compromise of these assets can have substantial consequences for organizations, including the compromise of core business functions and applications, and the data they contain.
Recommendations to Actively Manage Your Attack Surface
Most organizations are unprepared for an attack through an unknown or unmanaged exposure. We found eight of the nine organizations we studied had internet-accessible RDP vulnerable to brute-force attacks for at least 25% of the month.
To protect against these types of attack surface vulnerabilities, organizations should:
- Achieve continuous visibility
Maintain a comprehensive, real-time understanding of all internet-accessible assets, including cloud-based systems and services. This helps to actively discover, learn and respond to risks more quickly. - Address cloud misconfigurations
Regularly review and update cloud configurations, aligning with best practices to mitigate security risks. Foster collaboration between security and DevOps teams to secure cloud-native application development and deployment. - Prioritize remediation
Focus on addressing the most critical vulnerabilities and exposures, such as those with a high Common Vulnerability Scoring System (CVSS) score – which accounts for severity – and an Exploit Prediction Scoring System (EPSS) score – which accounts for likelihood – to reduce the chance of successful cyberattacks.
Organizations should consider an attack surface management program to continuously discover, prioritize and remediate exposures on their attack surface. This ensures that opportunistic attackers cannot exploit any unknown or unmanaged asset.
How Palo Alto Networks Can Help
Get the full 2023 Unit Attack Surface Threat Report for more global attack surface insights, trends and recommendations for best practices.
If attack surface management is new to your organization, or you’d like help with improving your program, Cortex Xpanse and Unit 42 Attack Surface Assessment can jump-start your journey. This assessment service gives you better visibility into your on-premises and cloud-based internet-connected assets and recommendations on prioritized actions to help you defend your organization.
Additional Resources
Get updates from
Palo Alto
Networks!
Sign up to receive the latest news, cyber threat intelligence and research from us
from Unit 42 https://bit.ly/457NumR
via IFTTT
No comments:
Post a Comment